 Roper Solar Greenhouse
215 Maywood Street, Blacksburg, Virginia
 Roper Solar Greenhouse
Back to the main YMCA Solar Greenhouse web page
YMCA Solar Greenhouse Construction Pictures
Heat Sink
Inside Construction
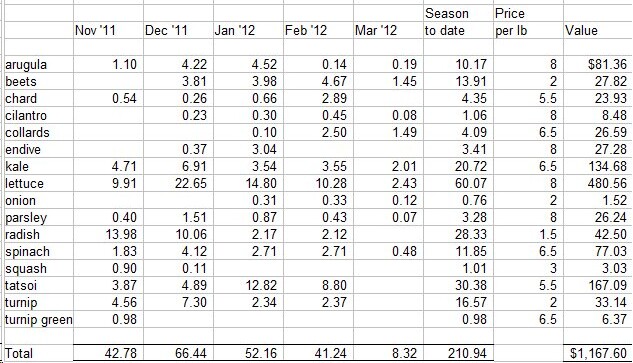
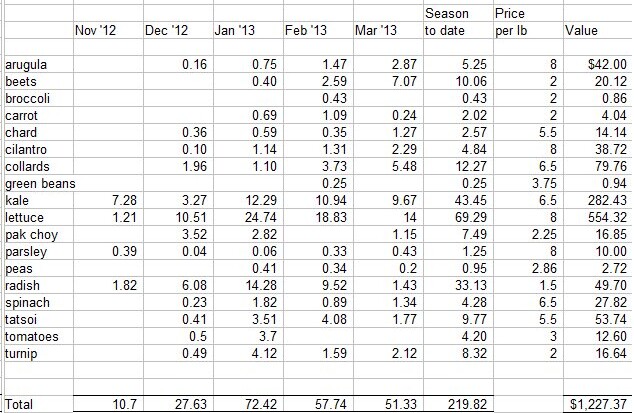
USDA Data Collection and Analysis Grant
Total Sums (lbs): |
|
lettuce |
58.2 |
spinach |
26.7 |
kale |
17.9 |
chard |
42.0 |
collard |
16.0 |
radish |
20.3 |
nasturtium |
2.0 |
beets |
38.6 |
arugula |
12.8 |
greens |
53.5 |
broccoli |
2.9 |
herbs |
4.7 |
gr onions |
3.3 |
cauliflower |
4.3 |
mustard |
1.8 |
turnips |
12.1 |
Total lbs |
317.2 |


Here is a description of the instrumentation that was installed in the YSGH at noon on 1 September 2009:
At noon on the 1 st of each succeeding month of the fall, winter and spring 2009 I will download the data and reset the data loggers for the next month. Then I will analyze the data and prepare a monthly report.
It is desirable to compare the YSGH operation temperature data to the external temperature data. Since there is not a mini-weather-station at the YSGH, the daily high and low temperature data taken at the Blacksburg VA National Weather Service Office are used for comparison. The distance between the weather station and the YSGH is about four miles.

The vertical grid lines are midnight.
The inverse relationship between temperature and relative humidity is obvious. This should not be so obvious when plants are in the SGH to transpire water from their leaves into the air at high temperatures. Also, when the heat-sink is working, the temperature spikes and troughs should be smoothed out.
Notice that there were 5 times when the heat-sink fan would have turned on to cool and dehumidify the air (>70 deg, the yellow horizontal line) and 5 times when the heat-sink fan would have turned on to heat and humidify the air (<50 deg, the green horizontal line). They were usually on the same days (day and night) because of a clear sky.
Both vent windows were open and the door and heat-sink fan had not been installed.

The vertical grid lines are midnight.
Notice the approximately two-hour delay of the temperature peaks after the light-intensity peaks. The data logger is on the north side of the center post out of direct sunlight. When the white-painted Hardie board is installed on the inside of the north roof, the light intensity and temperature at the data logger will be higher.
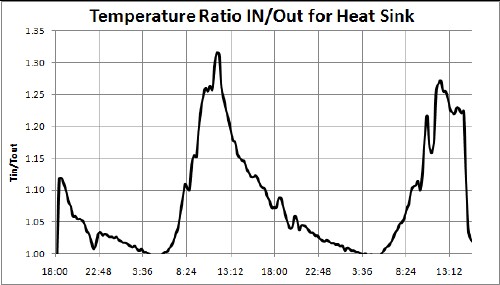
The heat sink is working!:
 |
 |
The data loggers to measure temperature and relative humidity were placed on the input screen (IN) and in front of the output screen (OUT). The fan speed was changed from high to low at about noon the first day (note the drop in temperature ratio).
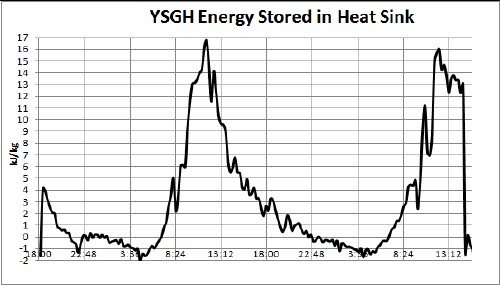
The main thing is that energy is being stored in the heat sink!:

This is the energy in kilojoules taken from the air moving through the heat sink per kilogram of air that moved through, which was stored in the rocks of the heat sink. So, if the temperature should go below 50 deg F in the next few days, some energy is available in the heat sink to keep the YSGH temperature above 50. Oh well, one can dream in the middle of June!
From a rough calculation of the energy being stored in the heat sink per hour it appears that the peak power is up to 5 kW. Over the time I measured it (less than three days), the average was about 1 kW. That is the equivalent of a long base-board heater running 24 hours a day.
I used a portable anemometer to measure the air speed coming out of the heat sink near the top of the horizontal outlet-pipes :
The flow decrease down the outlet; assume that the average is 5 ft/sec for the fan on high. The two outlet pipes are 12" in diameter. Thus, the volume of air per hour coming out of the pipes is:
V/t = 2 x (Area of outlet pipe in ft^2) x (flow in ft/sec) x (3600 sec/hr)
= 2 x (pi x radius^2) x (flow in ft/sec) x (3600 sec/hr) = 2 x (pi x 0.5^2) x 5 x 3600 =~ 28,000 ft^3/hr.
A SHCS requirement is that at least 5 times the volume of the SGH must flow through the heat sink per hour. The volume of the YSGH is about 5000 ft^3. Five times that is 25,000 ft^3/hr; so the requirement is met by 28,000 ft^3/hr.
A second SHCS requirement is that the air flow should not exceed 4 ft/sec in the 26 4" slotted pipes in the heat sink. Since the flow is inversely proportional to the pipe area, in the two 12" pipes the flow is
5 x( 2 x 6^2)/(26 x 2^2) = 5 x 72/104 =~ 3.5 ft/sec, below 4 ft/sec as required. It can be reduced by reducing the fan speed and still have 25,000 ft^3/hr air flow.
The SHCS SGH will operate at maximum efficiency when the difference in energy per mass stored in dry air and the water vapor between the air inlet and the air outlets is maximum. (Air pressure is assumed the same at the inlet and at the outlets.) The energy/mass stored in dry air is
Eair = 1.00464 T [kJ/kg°C] and the energy/mass stored in water vapor is Ewatervapor = w (1.846 T + 2502), where w = (vapor mass)/(dry air mass) in kg/kg. However, w is usually measured in g/kg, so the equation is then Ewatervapor = w (0.001846 T + 2.502). Approximately, in terms of relative humidity, H, w = wsat H/100 = 0.0420 H exp(0.06235 T), where wsat= w at saturation. So the total energy per mass of air/water-vapor at either the air inlet or the air outlet is
E = Eair + Ewatervapor = 1.00464 T + 0.0420 H (0.001846 T + 2.502) exp(0.06235 T) [kJ/kg]
This energy per mass of air is relative to the definition of zero energy at temperature 0°C and 0% humidity. So, the energy can be less than zero.
It is desired to calculate the energy per time (power) stored in the heat sink. The density of the air/water-vapor and the air flow are needed. The density is calculated by taking the average of the temperature and the average of the relative humidity at the heat-sink inlet and outlet. The equation for the density is
d = {352.987-0.8043*H*10^[7.5*T/(T+237.3)]}/(T+273.15), where T is in °C.
The power is (air flow; volume/time)*(energy/mass)*(density; mass/volume) = energy/time

L. David Roper, http://arts.bev.net/RoperLDavid/; roperld@vt.edu
28-Apr-2015