 Roper Solar Greenhouse
215 Maywood Street, Blacksburg, Virginia
April 2010
Roper Solar GreenhouseBack to the main YMCA Solar Greenhouse web page
Back to the Data for the YMCA Solar Greenhouse web page
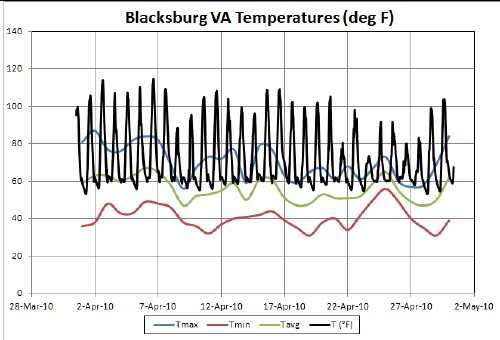
It is desirable to compare the YSGH operation temperature data to the external temperature data. Since there is not a mini-weather-station at the YSGH, the daily high and low temperature data taken at the Blacksburg VA National Weather Service Office are used for comparison. The distance between the weather station and the YSGH is about four miles.
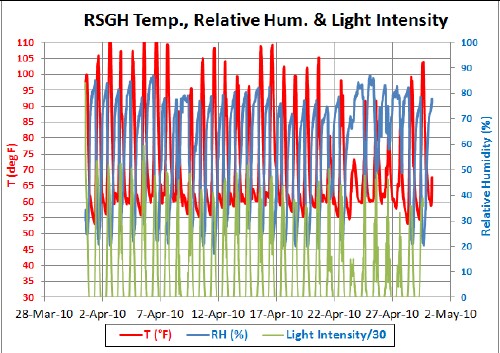 |
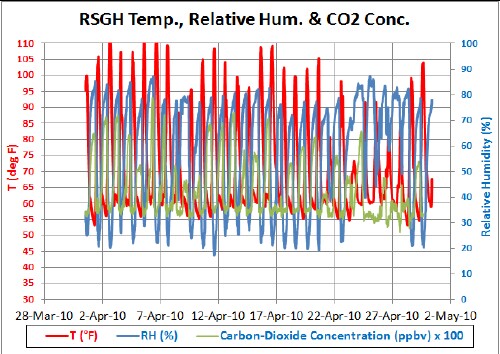
The green-data axis is on the right with the blue data. |
 |
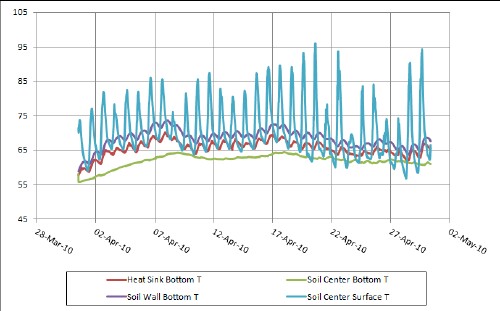
The black curve is the temperature at the center post in RSGH; the other curves are temperatures at the Blacksburg weather station. |
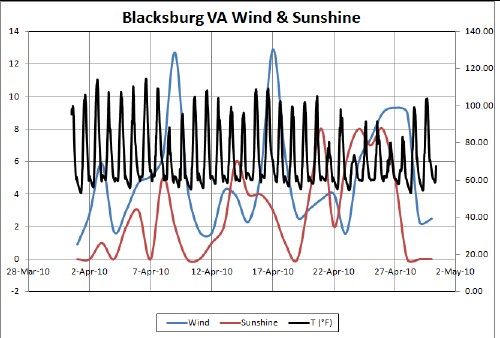 The units for wind & sunshine are arbitrary. Sunshine really means cloud cover in tenths of the sky. |
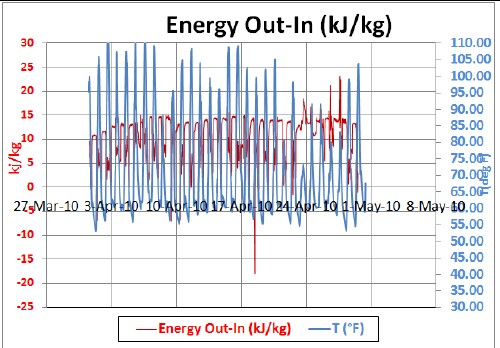
The daily cycle of energy being stored in and taken out of the heat sink is obvious. This calculation is not very accurate because the temperatures at the inlet and outet at the two ends of the RSGH may differ even when the heat-sink fan is not on. (The energy calculation involves temperature and relative humidity at the heat-sink outlet and inlet.) The high negative correlation between high temperatures and negative "energy out-in" is obvious.
Comparison of the four quadrants:
 |
 |
 |
 |
L. David Roper, http://arts.bev.net/RoperLDavid/; roperld@vt.edu
05-Oct-2010