(Back to
Politics)
(Back to Economy and Political
Parties)
(Down to tables of data.)
There are many different economic indicators that one might apply to rank United States presidential administrations and congresses on how well they handled the economy. I have picked the following:
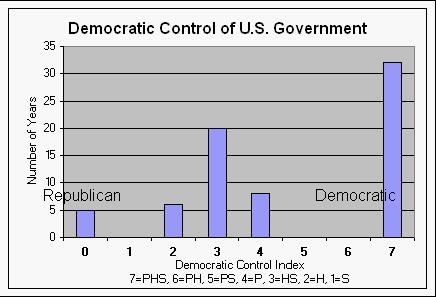
Now one needs a measure of political party control of the U.S. government. I use the following party control index:
There are other ways to quantify party control.
|
This graph shows the number of years each value of the party control index existed for the years 1930-1999. Most of the time the Democrats had full control of the presidency and the Congress (32 years with index=7) or full control of the Congress with a Republican president (20 years with index=3). Indices 1, 5 and 6 never occurred. |
I calculate a scores (S) for each value of the Democratic party control index since the Hoover administration using the following formula:
If C<0 (deflation) use: S=G-D+C-U; if C>0 (inflation) use:
S=G-D-C-U; i.e. S=G-D-|C|-U where |C|=absolute value of C.
This assumes that
high inflation (C>0) and high deflation (C<0) (depression) are equally
bad.
The scores for Democratic party control since 1929 are shown in the graph below and in the data table below the graph. (Republican party control is in the opposite direction across the graph.)
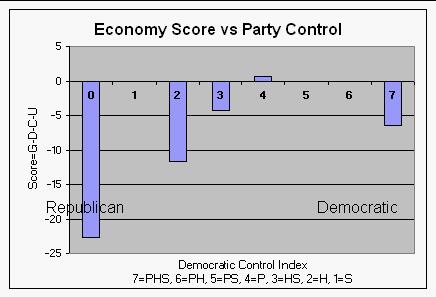 |
Party Control Economy Scores. Note that the highest scores occurred for years when Democratic party control was stronger than Republican control (index between 3 and 7); that is for years when the presidency was Democratic (index between 4 and 7) or the Congress was totally Democratic (index 3) with a Republican president. The lowest scores occurred for years when there was a Republican president either with Republican control of the Congress or only one house controlled by Democrats. |
| Graphs of the separate components of the economy score. | |
| Back to
top of Presidents' and Congresses' Economy Scores (Back to Politics) (Back to Economy and Political Parties) |
|
These are the values plotted in the graphs above:
| Democrat Control | Average % GDP Change | (-Average % Debt Decrease) | Average[ -ABS(% CPI change)] | (-Average Decrease % Unemployed) | Combined Averages (G-D-C-U) | Years |
| 0 | -9.01 | -4.57 | -4.54 | -4.59 | -22.71 | 5 |
| 1 | 0 | |||||
| 2 | 8.10 | -14.82 | -4.92 | 0.03 | -11.60 | 6 |
| 3 | 7.11 | -6.80 | -4.32 | -0.23 | -4.23 | 20 |
| 4 | 6.95 | -1.80 | -4.77 | 0.28 | 0.67 | 8 |
| 5 | 0 | |||||
| 6 | 0 | |||||
| 7 | 9.04 | -12.21 | -3.98 | 0.76 | -6.39 | 32 |
The table below gives the values used to calculate the economy scores for for the party control index since 1929. They are sorted by party control index instead of by year.
| Year | % GDP Change | % Debt Increase | ABS(% CPI Change) | % Unemployed Change | G-D-C-U | Senate Dem/Rep | House Dem/Rep | President Dem/Rep | Democrat Control | Year |
| 1929 | -3.8 | 0 | 0.70 | 0.61 | 0 | 0 | 1929 | |||
| 1930 | -11.96 | -4.4 | 2.3 | 5.50 | -15.35 | 0.70 | 0.61 | 0 | 0 | 1930 |
| 1931 | -16.10 | 3.8 | 9 | 7.20 | -36.11 | 0.98 | 0.99 | 0 | 0 | 1931 |
| 1932 | -23.24 | 16.0 | 9.9 | 7.70 | -56.82 | 0.98 | 0.99 | 0 | 0 | 1953 |
| 1953 | 5.94 | 2.7 | 0.8 | -0.10 | 2.55 | 0.96 | 0.96 | 0 | 0 | 1932 |
| 1954 | 0.32 | 4.8 | 0.7 | 2.67 | -7.82 | 0.96 | 0.96 | 0 | 0 | 1954 |
| 1981 | 12.01 | 10.6 | 10.3 | 0.44 | -9.32 | 0.87 | 1.26 | 0 | 2 | 1981 |
| 1982 | 4.08 | 16.4 | 6.2 | 2.09 | -20.57 | 0.87 | 1.26 | 0 | 2 | 1982 |
| 1983 | 8.46 | 17.8 | 3.2 | -0.11 | -12.48 | 0.85 | 1.62 | 0 | 2 | 1983 |
| 1984 | 11.25 | 17.9 | 4.3 | -2.09 | -8.84 | 0.85 | 1.62 | 0 | 2 | 1984 |
| 1985 | 7.13 | 17.0 | 3.6 | -0.32 | -13.17 | 0.89 | 1.39 | 0 | 2 | 1985 |
| 1986 | 5.69 | 9.2 | 1.9 | -0.19 | -5.23 | 0.89 | 1.39 | 0 | 2 | 1955 |
| 1955 | 8.95 | 0.7 | 0.4 | -1.23 | 9.05 | 1.02 | 1.14 | 0 | 3 | 1956 |
| 1956 | 5.49 | -1.5 | 1.5 | -0.24 | 5.71 | 1.02 | 1.14 | 0 | 3 | 1957 |
| 1957 | 5.37 | -0.6 | 3.3 | 0.18 | 2.52 | 1.04 | 1.16 | 0 | 3 | 1958 |
| 1958 | 1.39 | 2.9 | 2.8 | 2.54 | -6.87 | 1.04 | 1.16 | 0 | 3 | 1959 |
| 1959 | 8.44 | 2.8 | 0.7 | -1.39 | 6.29 | 1.88 | 1.85 | 0 | 3 | 1960 |
| 1960 | 3.94 | -0.3 | 1.7 | 0.09 | 2.41 | 1.88 | 1.85 | 0 | 3 | 1969 |
| 1969 | 8.10 | 2.8 | 5.5 | -0.07 | -0.18 | 1.38 | 1.27 | 0 | 3 | 1970 |
| 1970 | 5.52 | 5.7 | 5.7 | 1.49 | -7.36 | 1.38 | 1.27 | 0 | 3 | 1971 |
| 1971 | 8.55 | 9.0 | 4.4 | 0.97 | -5.80 | 1.23 | 1.42 | 0 | 3 | 1972 |
| 1972 | 9.91 | 5.9 | 3.2 | -0.35 | 1.12 | 1.23 | 1.42 | 0 | 3 | 1973 |
| 1973 | 11.70 | 4.6 | 6.2 | -0.74 | 1.63 | 1.33 | 1.26 | 0 | 3 | 1974 |
| 1974 | 8.34 | 4.8 | 11 | 0.78 | -8.27 | 1.33 | 1.26 | 0 | 3 | 1975 |
| 1975 | 8.94 | 17.0 | 9.1 | 2.83 | -20.04 | 1.65 | 2.02 | 0 | 3 | 1976 |
| 1976 | 11.54 | 13.3 | 5.8 | -0.77 | -6.82 | 1.65 | 2.02 | 0 | 3 | 1986 |
| 1987 | 6.50 | 10.6 | 3.6 | -0.83 | -6.86 | 1.22 | 1.46 | 0 | 3 | 1987 |
| 1988 | 7.71 | 10.7 | 4.1 | -0.68 | -6.43 | 1.22 | 1.46 | 0 | 3 | 1988 |
| 1989 | 7.45 | 9.8 | 4.8 | -0.23 | -6.91 | 1.22 | 1.49 | 0 | 3 | 1989 |
| 1990 | 5.72 | 13.2 | 5.4 | 0.36 | -13.19 | 1.22 | 1.49 | 0 | 3 | 1990 |
| 1991 | 3.15 | 13.4 | 4.2 | 1.23 | -15.64 | 1.27 | 1.60 | 0 | 3 | 1991 |
| 1992 | 5.56 | 10.9 | 3 | 0.64 | -8.98 | 1.27 | 1.60 | 0 | 3 | 1992 |
| 1947 | 9.94 | -4.1 | 14.4 | 0.00 | -0.33 | 0.88 | 0.76 | 1 | 4 | 1947 |
| 1948 | 10.31 | -2.3 | 8.1 | -0.15 | 4.68 | 0.88 | 0.76 | 1 | 4 | 1995 |
| 1995 | 4.91 | 6.0 | 2.8 | -0.51 | -3.38 | 0.92 | 0.89 | 1 | 4 | 1996 |
| 1996 | 5.58 | 5.0 | 3 | -0.18 | -2.28 | 0.92 | 0.89 | 1 | 4 | 1997 |
| 1997 | 6.47 | 3.6 | 2.3 | -0.48 | 1.04 | 0.87 | 0.92 | 1 | 4 | 1998 |
| 1998 | 5.67 | 2.1 | 0.6 | -0.43 | 3.42 | 0.87 | 0.92 | 1 | 4 | 1999 |
| 1999 | 5.79 | 2.4 | 2.2 | -0.28 | 1.51 | 0.87 | 0.95 | 1 | 4 | 2000 |
| 2000 | -0.22 | 0.87 | 0.95 | 1 | 4 | 1948 | ||||
| 1933 | -4.08 | 15.7 | 5.1 | 1.30 | -26.14 | 1.64 | 2.68 | 1 | 7 | 1946 |
| 1934 | 17.02 | 20.0 | 3.1 | -3.20 | -2.91 | 1.64 | 2.68 | 1 | 7 | 1952 |
| 1935 | 11.06 | 6.1 | 2.2 | -1.60 | 4.37 | 2.76 | 3.13 | 1 | 7 | 1980 |
| 1936 | 14.19 | 17.7 | 1.5 | -3.20 | -1.80 | 2.76 | 3.13 | 1 | 7 | 1994 |
| 1937 | 9.80 | 7.8 | 3.6 | -2.60 | 0.96 | 4.41 | 3.74 | 1 | 7 | 1933 |
| 1938 | -6.31 | 2.0 | 2.1 | 4.70 | -15.14 | 4.41 | 3.74 | 1 | 7 | 1934 |
| 1939 | 6.85 | 8.8 | 1.4 | -1.80 | -1.56 | 3.00 | 1.55 | 1 | 7 | 1935 |
| 1940 | 10.11 | 6.3 | 0.7 | -2.60 | 5.76 | 3.00 | 1.55 | 1 | 7 | 1936 |
| 1941 | 25.07 | 13.9 | 5 | -4.70 | 10.83 | 2.36 | 1.65 | 1 | 7 | 1937 |
| 1942 | 27.70 | 47.9 | 10.9 | -5.20 | -25.91 | 2.36 | 1.65 | 1 | 7 | 1938 |
| 1943 | 22.62 | 89.1 | 6.1 | -2.80 | -69.81 | 1.50 | 1.06 | 1 | 7 | 1939 |
| 1944 | 10.74 | 46.8 | 1.7 | -0.70 | -37.01 | 1.50 | 1.06 | 1 | 7 | 1940 |
| 1945 | 1.50 | 28.7 | 2.3 | 0.70 | -30.19 | 1.50 | 1.28 | 1 | 7 | 1941 |
| 1946 | -0.31 | 4.2 | 8.3 | 2.00 | -14.77 | 1.50 | 1.28 | 1 | 7 | 1942 |
| 1949 | -0.70 | 0.2 | 1.2 | 2.30 | -4.39 | 1.29 | 1.54 | 1 | 7 | 1943 |
| 1950 | 9.94 | 1.8 | 1.3 | -0.84 | 7.66 | 1.29 | 1.54 | 1 | 7 | 1944 |
| 1951 | 15.36 | -0.8 | 7.9 | -1.93 | 10.21 | 1.02 | 1.18 | 1 | 7 | 1945 |
| 1952 | 5.63 | 1.5 | 1.9 | -0.26 | 2.46 | 1.02 | 1.18 | 1 | 7 | 1949 |
| 1961 | 3.47 | 2.1 | 1 | 1.15 | -0.73 | 1.78 | 1.50 | 1 | 7 | 1950 |
| 1962 | 7.48 | 2.5 | 1 | -1.13 | 5.14 | 1.78 | 1.50 | 1 | 7 | 1951 |
| 1963 | 5.49 | 1.9 | 1.3 | 0.07 | 2.18 | 2.03 | 1.47 | 1 | 7 | 1961 |
| 1964 | 7.39 | 2.8 | 1.3 | -0.48 | 3.79 | 2.03 | 1.47 | 1 | 7 | 1962 |
| 1965 | 8.38 | 0.9 | 1.6 | -0.65 | 6.50 | 2.13 | 2.11 | 1 | 7 | 1963 |
| 1966 | 9.61 | 2.6 | 2.9 | -0.72 | 4.80 | 2.13 | 2.11 | 1 | 7 | 1964 |
| 1967 | 5.68 | 4.7 | 3.1 | 0.05 | -2.13 | 1.78 | 1.33 | 1 | 7 | 1965 |
| 1968 | 9.28 | 3.9 | 4.2 | -0.28 | 1.48 | 1.78 | 1.33 | 1 | 7 | 1966 |
| 1977 | 11.38 | 10.0 | 6.5 | -0.65 | -4.48 | 1.61 | 2.04 | 1 | 7 | 1967 |
| 1978 | 13.02 | 9.8 | 7.6 | -0.98 | -3.37 | 1.61 | 2.04 | 1 | 7 | 1968 |
| 1979 | 11.78 | 7.1 | 11.3 | -0.22 | -6.39 | 1.41 | 1.75 | 1 | 7 | 1977 |
| 1980 | 8.93 | 10.1 | 13.5 | 1.33 | -15.96 | 1.41 | 1.75 | 1 | 7 | 1978 |
| 1993 | 5.12 | 8.5 | 3 | -0.58 | -5.83 | 1.33 | 1.47 | 1 | 7 | 1979 |
| 1994 | 6.20 | 6.4 | 2.6 | -0.81 | -1.96 | 1.33 | 1.47 | 1 | 7 | 1993 |
| Year | % GDP Change | % Debt Increase | ABS(% CPI Change) | Change | Senate D/R | House D/R | Dem./Rep. | Year |