Inflation/Deflation Index and
Political Parties
(Back to
Politics)
(Back to Economy and Political
Parties)
(Go to data tables at
bottom.)
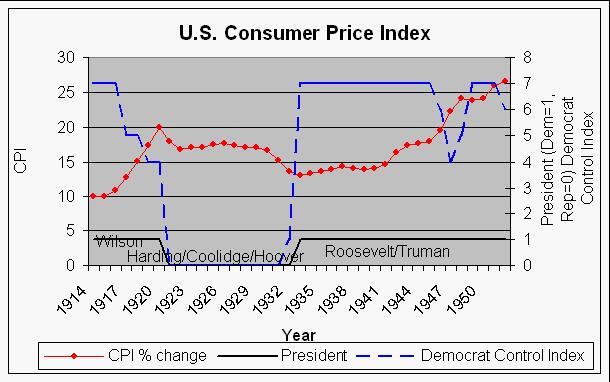 |
| This shows the U.S. Consumer Price Index for the years 1914-1952
compared to the presidential terms (Dem=1, Rep=0) and Democratic control index
of the federal government (see below for definition). Note
the large deflations (negative inflation) in the Harding and the Hoover
administrations (Great Depression 1929-1933), with near constant values in the
intervening years. Note the large inflations during the WW I (1914-1918) and WW
II (1939-1945) years and after the wars and during the Korean War
(1949-1953). |
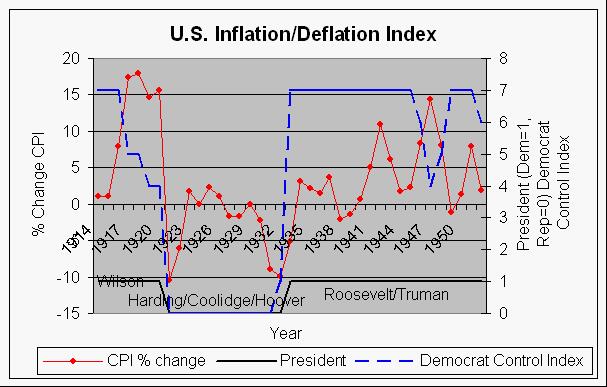 |
| This shows the change in U.S. Consumer Price (inflation/deflation)
Index from year to year for the years 1914-1952 compared presidential terms
(Dem=1, Rep=0) and Democratic control index of the federal government (see below for definition). Note the large deflations
(negative inflation) in the Harding and the Hoover administrations (Great
Depression 1929-1933), with near zero change values in the intervening years.
Note the large inflations during the WW I (1914-1918) and WW II (1939-1945)
years and after the wars and during the Korean War (1949-1953). |
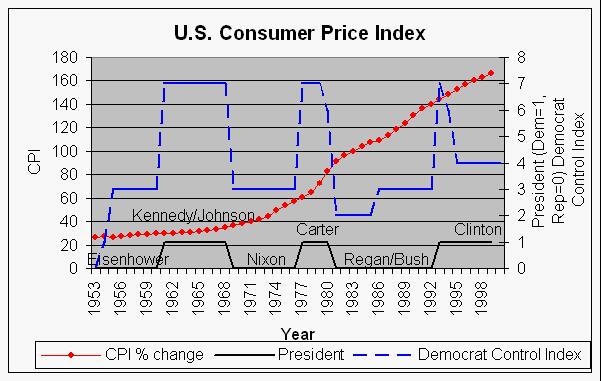 |
| This shows the U.S. Consumer Price Index for the years 1953-1999
compared to the presidential terms (Dem=1, Rep=0) and Democratic control index
of the federal government (see below for definition). Note
the climbing inflation during the Vietnam War (1965-1975) and after the war. A
leveling off started at the end of the Carter administration, but then it
started increasing again during the Reagan administration, probably because of
the huge tax cuts without decreasing government spending. |
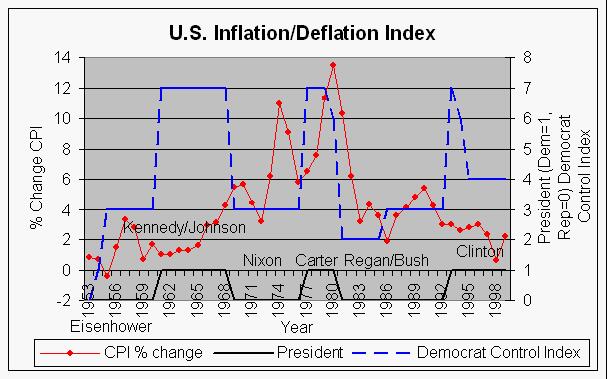 |
| This shows the change in U.S. Consumer Price (inflation) Index from
year to year for the years 1953-1999 compared to the presidential terms (Dem=1,
Rep=0) and Democratic control index of the federal government (see below for definition). Note the climbing inflation during
the Vietnam War (1965-1975) and after the war. A fast decline started at the
end of the Carter administration, but then it started increasing again during
the Reagan administration, probably because of the huge tax cuts without
decreasing government spending. The Eisenhower and the Clinton administrations
had the best records, although there were larger fluctuations in the Eisenhower
years. |
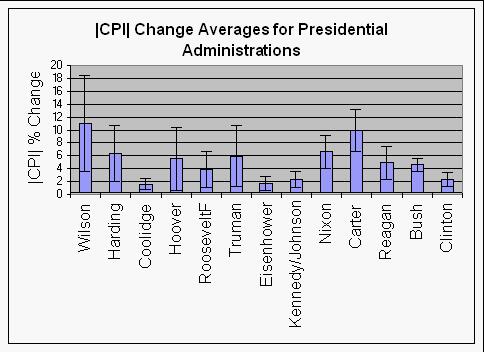 |
This shows the average % change in the absolute value of the CPI
for presidential administrations. Standard deviations are shown. Note the lows
Coolidge, Eisenhower, Kennedy/Johnson and Clinton. |
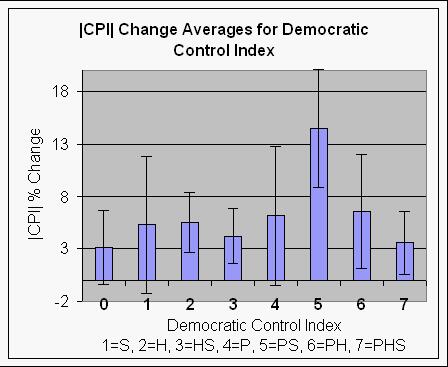 |
This shows the average % change in the absolute value of the CPI
for the Democratic control index (see below for
definition). Standard deviations are shown. Note the lows for full
Republican (index 0) and full Democratic (index 7) control, closely followed by
Republican president and Democratic House and Senate (index 3). The highest
average is for Democratic and Senate (index 5). |
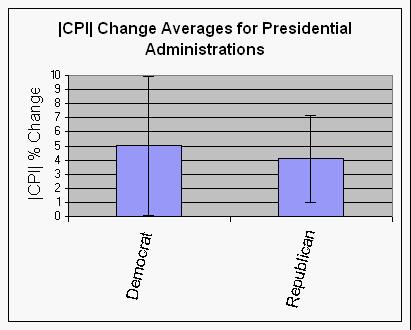 |
This shows the average % change in the absolute value of the CPI
plotted for presidential administrations by political party. Standard
deviations are shown. Considering the large standard deviation for the
Republican presidents, there is very little difference between the two
parties. |
The Democratic Control Index is
defined as
- 7=Democratic party has presidency and majorities in both the
Senate and House.
- 6=Democratic party has presidency and majority in the
House.
- 5=Democratic party has presidency and majority in the
Senate.
- 4=Democratic party has presidency only.
- 3=Democratic party has majority in the House and Senate, but
not the presidency.
- 2=Democratic party has majority in the House only and not the
presidency.
- 1=Democratic party has majority in the Senate only and not the
presidency.
- 0=Democratic party is in minority in both the Senate and the
House and does not have the presidency.
|
| A diagram showing the
Democratic Party Control Index: |
| Democratic Control |
Democratic Party Control
Index |
Republican Control |
| nothing |
0 |
President, House & Senate |
| Senate |
1 |
President & House |
| House |
2 |
President & Senate |
| House & Senate |
3 |
President |
| President |
4 |
House & Senate |
| President & Senate |
5 |
House |
| President & House |
6 |
Senate |
| President, House & Senate |
7 |
nothing |
The correlation coefficients for Democratic control of the Senate, House
and presidency with the % change in the absolute value of the CPI are:
| Correlations |
% |CPI| Change |
| President Dem. |
0.111 |
| Democratic Control Index |
0.018 |
Thus, we see that change in |CPI| occurs about 11% more often when we
have a Democratic president and there is essentially no correlation with full
Democratic control of the government.
The correlation coefficients for Democratic control of the Senate, House
and presidency with the % change in the absolute value of the CPI for
administrations since Franklin Roosevelts' the correlations are:
| Correlations |
% Debt/GDP Change |
| President Dem. |
0 |
| Democratic Control Index |
0.04 |
Thus, there is essentially no correlation for party control.
(Back to the top of
Inflation Index)
(Back to Economy and Political
Parties)
(Back to Politics)
These data can be found at
http://www.jsc.nasa.gov/bu2/inflateCPI.html.
|
|
|
Senate |
|
|
House |
|
|
President |
|
|
|
| Year |
CPI |
% CPI change |
Dem. |
Rep. |
Senate D/R |
Dem. |
Rep. |
House D/R |
Dem. |
Rep. |
Year |
|
| 1913 |
9.9 |
|
51 |
44 |
1.16 |
290 |
127 |
2.28 |
1 |
0 |
1913 |
Wilson |
| 1914 |
10 |
1 |
51 |
44 |
1.16 |
290 |
127 |
2.28 |
1 |
0 |
1914 |
Wilson |
| 1915 |
10.1 |
1 |
56 |
39 |
1.44 |
231 |
193 |
1.20 |
1 |
0 |
1915 |
Wilson |
| 1916 |
10.9 |
7.9 |
56 |
39 |
1.44 |
231 |
193 |
1.20 |
1 |
0 |
1916 |
Wilson |
| 1917 |
12.8 |
17.4 |
53 |
42 |
1.26 |
210 |
216 |
0.97 |
1 |
0 |
1917 |
Wilson |
| 1918 |
15.1 |
18 |
53 |
42 |
1.26 |
210 |
216 |
0.97 |
1 |
0 |
1918 |
Wilson |
| 1919 |
17.3 |
14.6 |
47 |
48 |
0.98 |
191 |
237 |
0.81 |
1 |
0 |
1919 |
Wilson |
| 1920 |
20 |
15.6 |
47 |
48 |
0.98 |
191 |
237 |
0.81 |
1 |
0 |
1920 |
Wilson |
| 1921 |
17.9 |
-10.5 |
37 |
59 |
0.63 |
132 |
300 |
0.44 |
0 |
1 |
1921 |
Harding |
| 1922 |
16.8 |
-6.1 |
37 |
59 |
0.63 |
132 |
300 |
0.44 |
0 |
1 |
1922 |
Harding |
| 1923 |
17.1 |
1.8 |
43 |
51 |
0.84 |
207 |
225 |
0.92 |
0 |
1 |
1923 |
Harding/Coolidge |
| 1924 |
16.8 |
0 |
43 |
51 |
0.84 |
207 |
225 |
0.92 |
0 |
1 |
1924 |
Coolidge |
| 1925 |
17.5 |
2.3 |
40 |
54 |
0.74 |
183 |
247 |
0.74 |
0 |
1 |
1925 |
Coolidge |
| 1926 |
17.7 |
1.1 |
40 |
54 |
0.74 |
183 |
247 |
0.74 |
0 |
1 |
1926 |
Coolidge |
| 1927 |
17.4 |
-1.7 |
47 |
48 |
0.98 |
195 |
237 |
0.82 |
0 |
1 |
1927 |
Coolidge |
| 1928 |
17.1 |
-1.7 |
47 |
48 |
0.98 |
195 |
237 |
0.82 |
0 |
0 |
1928 |
Coolidge |
| 1929 |
17.1 |
0 |
39 |
56 |
0.70 |
163 |
267 |
0.61 |
0 |
1 |
1929 |
Hoover |
| 1930 |
16.7 |
-2.3 |
39 |
56 |
0.70 |
163 |
267 |
0.61 |
0 |
1 |
1930 |
Hoover |
| 1931 |
15.2 |
-9 |
47 |
48 |
0.98 |
216 |
218 |
0.99 |
0 |
1 |
1931 |
Hoover |
| 1932 |
13.7 |
-9.9 |
47 |
48 |
0.98 |
216 |
218 |
0.99 |
0 |
1 |
1932 |
Hoover |
| 1933 |
13 |
-5.1 |
59 |
36 |
1.64 |
313 |
117 |
2.68 |
1 |
0 |
1933 |
RooseveltF |
| 1934 |
13.4 |
3.1 |
59 |
36 |
1.64 |
313 |
117 |
2.68 |
1 |
0 |
1934 |
RooseveltF |
| 1935 |
13.7 |
2.2 |
69 |
25 |
2.76 |
322 |
103 |
3.13 |
1 |
0 |
1935 |
RooseveltF |
| 1936 |
13.9 |
1.5 |
69 |
25 |
2.76 |
322 |
103 |
3.13 |
1 |
0 |
1936 |
RooseveltF |
| 1937 |
14.4 |
3.6 |
75 |
17 |
4.41 |
333 |
89 |
3.74 |
1 |
0 |
1937 |
RooseveltF |
| 1938 |
14.1 |
-2.1 |
75 |
17 |
4.41 |
333 |
89 |
3.74 |
1 |
0 |
1938 |
RooseveltF |
| 1939 |
13.9 |
-1.4 |
69 |
23 |
3.00 |
262 |
169 |
1.55 |
1 |
0 |
1939 |
RooseveltF |
| 1940 |
14 |
0.7 |
69 |
23 |
3.00 |
262 |
169 |
1.55 |
1 |
0 |
1940 |
RooseveltF |
| 1941 |
14.7 |
5 |
66 |
28 |
2.36 |
267 |
162 |
1.65 |
1 |
0 |
1941 |
RooseveltF |
| 1942 |
16.3 |
10.9 |
66 |
28 |
2.36 |
267 |
162 |
1.65 |
1 |
0 |
1942 |
RooseveltF |
| 1943 |
17.3 |
6.1 |
57 |
38 |
1.50 |
222 |
209 |
1.06 |
1 |
0 |
1943 |
RooseveltF |
| 1944 |
17.6 |
1.7 |
57 |
38 |
1.50 |
222 |
209 |
1.06 |
1 |
0 |
1944 |
RooseveltF |
| 1945 |
18 |
2.3 |
57 |
38 |
1.50 |
243 |
190 |
1.28 |
1 |
0 |
1945 |
RooseveltF/Truman |
| 1946 |
19.5 |
8.3 |
57 |
38 |
1.50 |
243 |
190 |
1.28 |
1 |
0 |
1946 |
Truman |
| 1947 |
22.3 |
14.4 |
45 |
51 |
0.88 |
188 |
246 |
0.76 |
1 |
0 |
1947 |
Truman |
| 1948 |
24.1 |
8.1 |
45 |
51 |
0.88 |
188 |
246 |
0.76 |
1 |
0 |
1948 |
Truman |
| 1949 |
23.8 |
-1.2 |
54 |
42 |
1.29 |
263 |
171 |
1.54 |
1 |
0 |
1949 |
Truman |
| 1950 |
24.1 |
1.3 |
54 |
42 |
1.29 |
263 |
171 |
1.54 |
1 |
0 |
1950 |
Truman |
| 1951 |
26 |
7.9 |
48 |
47 |
1.02 |
234 |
199 |
1.18 |
1 |
0 |
1951 |
Truman |
| 1952 |
26.5 |
1.9 |
48 |
47 |
1.02 |
234 |
199 |
1.18 |
1 |
0 |
1952 |
Truman |
| 1953 |
26.7 |
0.8 |
46 |
48 |
0.96 |
213 |
221 |
0.96 |
0 |
1 |
1953 |
Eisenhower |
| 1954 |
26.9 |
0.7 |
46 |
48 |
0.96 |
213 |
221 |
0.96 |
0 |
1 |
1954 |
Eisenhower |
| 1955 |
26.8 |
-0.4 |
48 |
47 |
1.02 |
232 |
203 |
1.14 |
0 |
1 |
1955 |
Eisenhower |
| 1956 |
27.2 |
1.5 |
48 |
47 |
1.02 |
232 |
203 |
1.14 |
0 |
1 |
1956 |
Eisenhower |
| 1957 |
28.1 |
3.3 |
49 |
47 |
1.04 |
234 |
201 |
1.16 |
0 |
1 |
1957 |
Eisenhower |
| 1958 |
28.9 |
2.8 |
49 |
47 |
1.04 |
234 |
201 |
1.16 |
0 |
1 |
1958 |
Eisenhower |
| 1959 |
29.1 |
0.7 |
64 |
34 |
1.88 |
283 |
153 |
1.85 |
0 |
1 |
1959 |
Eisenhower |
| 1960 |
29.6 |
1.7 |
64 |
34 |
1.88 |
283 |
153 |
1.85 |
0 |
1 |
1960 |
Eisenhower |
| 1961 |
29.9 |
1 |
64 |
36 |
1.78 |
262 |
175 |
1.50 |
1 |
0 |
1961 |
Kennedy |
| 1962 |
30.2 |
1 |
64 |
36 |
1.78 |
262 |
175 |
1.50 |
1 |
0 |
1962 |
Kennedy/Johnson |
| 1963 |
30.6 |
1.3 |
67 |
33 |
2.03 |
258 |
176 |
1.47 |
1 |
0 |
1963 |
Johnson |
| 1964 |
31 |
1.3 |
67 |
33 |
2.03 |
258 |
176 |
1.47 |
1 |
0 |
1964 |
Johnson |
| 1965 |
31.5 |
1.6 |
68 |
32 |
2.13 |
295 |
140 |
2.11 |
1 |
0 |
1965 |
Johnson |
| 1966 |
32.4 |
2.9 |
68 |
32 |
2.13 |
295 |
140 |
2.11 |
1 |
0 |
1966 |
Johnson |
| 1967 |
33.4 |
3.1 |
64 |
36 |
1.78 |
248 |
187 |
1.33 |
1 |
0 |
1967 |
Johnson |
| 1968 |
34.8 |
4.2 |
64 |
36 |
1.78 |
248 |
187 |
1.33 |
1 |
0 |
1968 |
Johnson |
| 1969 |
36.7 |
5.5 |
58 |
42 |
1.38 |
243 |
192 |
1.27 |
0 |
1 |
1969 |
Nixon |
| 1970 |
38.8 |
5.7 |
58 |
42 |
1.38 |
243 |
192 |
1.27 |
0 |
1 |
1970 |
Nixon |
| 1971 |
40.5 |
4.4 |
54 |
44 |
1.23 |
255 |
180 |
1.42 |
0 |
1 |
1971 |
Nixon |
| 1972 |
41.8 |
3.2 |
54 |
44 |
1.23 |
255 |
180 |
1.42 |
0 |
1 |
1972 |
Nixon |
| 1973 |
44.4 |
6.2 |
56 |
42 |
1.33 |
242 |
192 |
1.26 |
0 |
1 |
1973 |
Nixon |
| 1974 |
49.3 |
11 |
56 |
42 |
1.33 |
242 |
192 |
1.26 |
0 |
1 |
1974 |
Nixon |
| 1975 |
53.8 |
9.1 |
61 |
37 |
1.65 |
291 |
144 |
2.02 |
0 |
1 |
1975 |
Nixon |
| 1976 |
56.9 |
5.8 |
61 |
37 |
1.65 |
291 |
144 |
2.02 |
0 |
1 |
1976 |
Nixon |
| 1977 |
60.6 |
6.5 |
61 |
38 |
1.61 |
292 |
143 |
2.04 |
1 |
0 |
1977 |
Carter |
| 1978 |
65.2 |
7.6 |
61 |
38 |
1.61 |
292 |
143 |
2.04 |
1 |
0 |
1978 |
Carter |
| 1979 |
72.6 |
11.3 |
58 |
41 |
1.41 |
277 |
158 |
1.75 |
1 |
0 |
1979 |
Reagan |
| 1980 |
82.4 |
13.5 |
58 |
41 |
1.41 |
277 |
158 |
1.75 |
1 |
0 |
1980 |
Reagan |
| 1981 |
90.9 |
10.3 |
46 |
53 |
0.87 |
242 |
192 |
1.26 |
0 |
1 |
1981 |
Reagan |
| 1982 |
96.5 |
6.2 |
46 |
53 |
0.87 |
242 |
192 |
1.26 |
0 |
1 |
1982 |
Reagan |
| 1983 |
99.6 |
3.2 |
46 |
54 |
0.85 |
269 |
166 |
1.62 |
0 |
1 |
1983 |
Reagan |
| 1984 |
103.9 |
4.3 |
46 |
54 |
0.85 |
269 |
166 |
1.62 |
0 |
1 |
1984 |
Reagan |
| 1985 |
107.6 |
3.6 |
47 |
53 |
0.89 |
253 |
182 |
1.39 |
0 |
1 |
1985 |
Reagan |
| 1986 |
109.6 |
1.9 |
47 |
53 |
0.89 |
253 |
182 |
1.39 |
0 |
1 |
1986 |
Reagan |
| 1987 |
113.6 |
3.6 |
55 |
45 |
1.22 |
258 |
177 |
1.46 |
0 |
1 |
1987 |
Reagan |
| 1988 |
118.3 |
4.1 |
55 |
45 |
1.22 |
258 |
177 |
1.46 |
0 |
1 |
1988 |
Bush |
| 1989 |
124 |
4.8 |
55 |
45 |
1.22 |
260 |
175 |
1.49 |
0 |
1 |
1989 |
Bush |
| 1990 |
130.7 |
5.4 |
55 |
45 |
1.22 |
260 |
175 |
1.49 |
0 |
1 |
1990 |
Bush |
| 1991 |
136.2 |
4.2 |
56 |
44 |
1.27 |
267 |
167 |
1.60 |
0 |
1 |
1991 |
Bush |
| 1992 |
140.3 |
3 |
56 |
44 |
1.27 |
267 |
167 |
1.60 |
0 |
1 |
1992 |
Bush |
| 1993 |
144.5 |
3 |
57 |
43 |
1.33 |
258 |
176 |
1.47 |
1 |
0 |
1993 |
Clinton |
| 1994 |
148.2 |
2.6 |
57 |
43 |
1.33 |
258 |
176 |
1.47 |
1 |
0 |
1994 |
Clinton |
| 1995 |
152.4 |
2.8 |
48 |
52 |
0.92 |
204 |
230 |
0.89 |
1 |
0 |
1995 |
Clinton |
| 1996 |
156.9 |
3 |
48 |
52 |
0.92 |
204 |
230 |
0.89 |
1 |
0 |
1996 |
Clinton |
| 1997 |
160.5 |
2.3 |
45 |
52 |
0.87 |
207 |
226 |
0.92 |
1 |
0 |
1997 |
Clinton |
| 1998 |
163 |
0.6 |
45 |
52 |
0.87 |
207 |
226 |
0.92 |
1 |
0 |
1998 |
Clinton |
| 1999 |
166.6 |
2.2 |
45 |
52 |
0.87 |
211 |
223 |
0.95 |
1 |
0 |
1999 |
Clinton |
|
|
|
45 |
52 |
0.87 |
211 |
223 |
0.95 |
1 |
0 |
2000 |
Clinton |
(Back
to the top of Inflation Index)
(Back to Economy
and Political Parties)
(Back to
Politics) |