(Back to
Politics)
(Back to Economy and Political
Parties)
Contents: Democrat Control Index | Democrat Control Variable | Bipartisan Control Index
We desire a way to quantify the control of the Democrat and Republican parties of the U.S. government.
One way is to assign a Democrat Control Index:
| A diagram showing the Democratic Party Control Index: | ||
| Democratic Control | Democratic Party Control Index | Republican Control |
| nothing | 0 | President, House & Senate |
| Senate | 1 | President & House |
| House | 2 | President & Senate |
| House & Senate | 3 | President |
| President | 4 | House & Senate |
| President & Senate | 5 | House |
| President & House | 6 | Senate |
| President, House & Senate | 7 | nothing |
Another way to quantify the control of the Democrat and Republican parties of the U.S. government is to assign a Democrat Control Variable is as follows:
| P= | 1 for Democrat president |
| 0 for Republican president |
| S= | fraction of Senate that is Democratic |
| H= | fraction of House that is Democratic |
Then define the Democrat Control Variable as:
| DCV= | P | for S<=¼ & H<=¼ |
| P+S-¼ | for H<=¼ & ¼<S<¾ | |
| P+H-¼ | for S<=¼ & ¼<H<¾ | |
| P+S+H-½ | for ¼<S<¾ & ¼<H<¾ | |
| P+H+¼ | for S>=¾ & ¼<H<¾ | |
| P+S+¼ | for H>=¾ & ¼<S<¾ | |
| P+1 | for S>=¾ & H>=¾ |
The Excel formula for calculating the DCV is +K6+IF(AND(N6<0.25,O6<0.25),0,IF(AND(N6>0.75,O6>0.75),1, IF(N6<0.25,O6-0.25,IF(O6<0.25,N6-0.25,IF(N6>0.75,O6+0.25,IF(O6>0.75,N6+0.25,N6+O6-0.5)))))).
This assumes that Democrat control for the Senate or House has nill effect when the fraction is below ¼ and does not increase when the fraction is above ¾. It also assumes that full control of both houses of Congress is equivalent to presidency control. A cruder, but easier to calculate, DCV=P+½(S+H) assumes some power accrues even when a fraction is quite low.
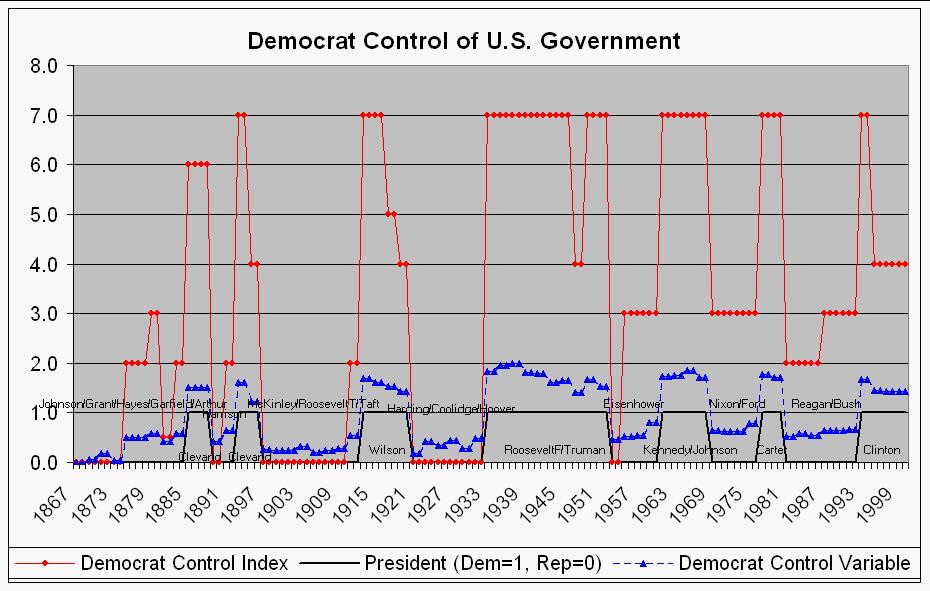
The graphs below shows the Democrat Control Index and the Democrat Control Variable for the years 1867-2000.
|
| The graph above shows the Democrat Control Index and the Democrat Control Variable versus year. |
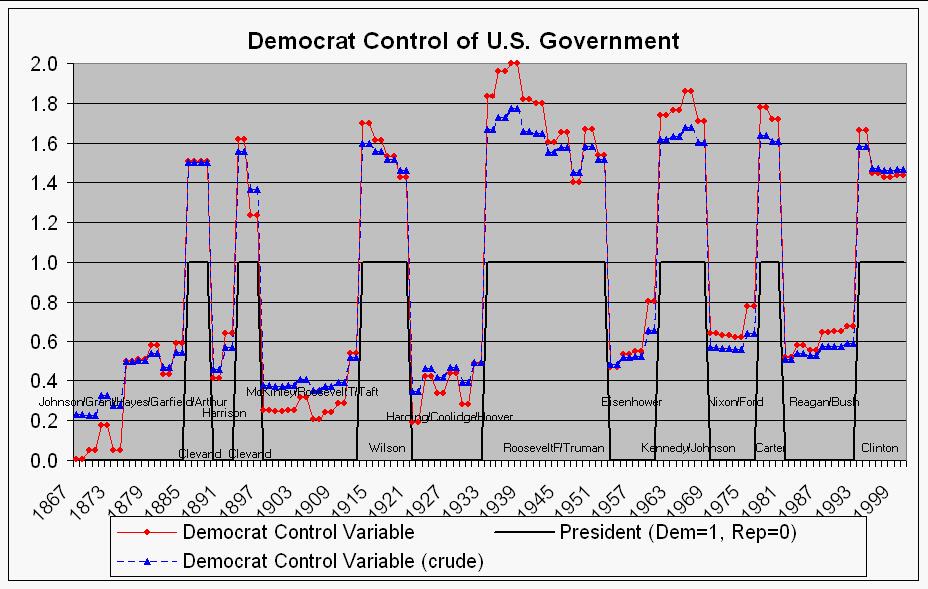 |
| The graph above shows the refined and crude Democrat Control Variables versus year. |
The table below shows the Democrat Control Index and the Democrat Control Variable for the years 1867-2000.
| Years | Democrat Control Index | Democrat Control Variable | Democrat Control Variable (crude) |
| 1867 | 0 | 0.004 | 0.231 |
| 1868 | 0 | 0.004 | 0.231 |
| 1869 | 0 | 0.050 | 0.225 |
| 1870 | 0 | 0.050 | 0.225 |
| 1871 | 0 | 0.178 | 0.326 |
| 1872 | 0 | 0.178 | 0.326 |
| 1873 | 0 | 0.050 | 0.275 |
| 1874 | 0 | 0.050 | 0.275 |
| 1875 | 2 | 0.499 | 0.500 |
| 1876 | 2 | 0.499 | 0.500 |
| 1877 | 2 | 0.506 | 0.503 |
| 1878 | 2 | 0.506 | 0.503 |
| 1879 | 3 | 0.578 | 0.539 |
| 1880 | 3 | 0.578 | 0.539 |
| 1881 | 0.5 | 0.431 | 0.465 |
| 1882 | 0.5 | 0.431 | 0.465 |
| 1883 | 2 | 0.589 | 0.545 |
| 1884 | 2 | 0.589 | 0.545 |
| 1885 | 6 | 1.507 | 1.504 |
| 1886 | 6 | 1.507 | 1.504 |
| 1887 | 6 | 1.510 | 1.505 |
| 1888 | 6 | 1.510 | 1.505 |
| 1889 | 0 | 0.413 | 0.457 |
| 1890 | 0 | 0.413 | 0.457 |
| 1891 | 2 | 0.637 | 0.568 |
| 1892 | 2 | 0.637 | 0.568 |
| 1893 | 7 | 1.618 | 1.559 |
| 1894 | 7 | 1.618 | 1.559 |
| 1895 | 4 | 1.234 | 1.367 |
| 1896 | 4 | 1.234 | 1.367 |
| 1897 | 0 | 0.253 | 0.377 |
| 1898 | 0 | 0.253 | 0.377 |
| 1899 | 0 | 0.245 | 0.373 |
| 1900 | 0 | 0.245 | 0.373 |
| 1901 | 0 | 0.251 | 0.375 |
| 1902 | 0 | 0.251 | 0.375 |
| 1903 | 0 | 0.317 | 0.408 |
| 1904 | 0 | 0.317 | 0.408 |
| 1905 | 0 | 0.208 | 0.354 |
| 1906 | 0 | 0.208 | 0.354 |
| 1907 | 0 | 0.240 | 0.370 |
| 1908 | 0 | 0.240 | 0.370 |
| 1909 | 0 | 0.288 | 0.394 |
| 1910 | 0 | 0.288 | 0.394 |
| 1911 | 2 | 0.540 | 0.520 |
| 1912 | 2 | 0.540 | 0.520 |
| 1913 | 7 | 1.698 | 1.599 |
| 1914 | 7 | 1.698 | 1.599 |
| 1915 | 7 | 1.614 | 1.557 |
| 1916 | 7 | 1.614 | 1.557 |
| 1917 | 5 | 1.535 | 1.517 |
| 1918 | 5 | 1.535 | 1.517 |
| 1919 | 4 | 1.429 | 1.464 |
| 1920 | 4 | 1.429 | 1.464 |
| 1921 | 0 | 0.189 | 0.344 |
| 1922 | 0 | 0.189 | 0.344 |
| 1923 | 0 | 0.424 | 0.462 |
| 1924 | 0 | 0.424 | 0.462 |
| 1925 | 0 | 0.337 | 0.419 |
| 1926 | 0 | 0.337 | 0.419 |
| 1927 | 0 | 0.438 | 0.469 |
| 1928 | 0 | 0.438 | 0.469 |
| 1929 | 0 | 0.281 | 0.390 |
| 1930 | 0 | 0.281 | 0.390 |
| 1931 | 0 | 0.486 | 0.493 |
| 1932 | 0 | 0.486 | 0.493 |
| 1933 | 7 | 1.834 | 1.667 |
| 1934 | 7 | 1.834 | 1.667 |
| 1935 | 7 | 1.959 | 1.729 |
| 1936 | 7 | 1.959 | 1.729 |
| 1937 | 7 | 2.000 | 1.773 |
| 1938 | 7 | 2.000 | 1.773 |
| 1939 | 7 | 1.821 | 1.661 |
| 1940 | 7 | 1.821 | 1.661 |
| 1941 | 7 | 1.801 | 1.651 |
| 1942 | 7 | 1.801 | 1.651 |
| 1943 | 7 | 1.604 | 1.552 |
| 1944 | 7 | 1.604 | 1.552 |
| 1945 | 7 | 1.652 | 1.576 |
| 1946 | 7 | 1.652 | 1.576 |
| 1947 | 4 | 1.401 | 1.450 |
| 1948 | 4 | 1.401 | 1.450 |
| 1949 | 7 | 1.667 | 1.584 |
| 1950 | 7 | 1.667 | 1.584 |
| 1951 | 7 | 1.538 | 1.519 |
| 1952 | 7 | 1.538 | 1.519 |
| 1953 | 0 | 0.469 | 0.484 |
| 1954 | 0 | 0.469 | 0.484 |
| 1955 | 3 | 0.533 | 0.517 |
| 1956 | 3 | 0.533 | 0.517 |
| 1957 | 3 | 0.548 | 0.524 |
| 1958 | 3 | 0.548 | 0.524 |
| 1959 | 3 | 0.802 | 0.651 |
| 1960 | 3 | 0.802 | 0.651 |
| 1961 | 7 | 1.740 | 1.620 |
| 1962 | 7 | 1.740 | 1.620 |
| 1963 | 7 | 1.763 | 1.632 |
| 1964 | 7 | 1.763 | 1.632 |
| 1965 | 7 | 1.858 | 1.679 |
| 1966 | 7 | 1.858 | 1.679 |
| 1967 | 7 | 1.710 | 1.605 |
| 1968 | 7 | 1.710 | 1.605 |
| 1969 | 3 | 0.639 | 0.569 |
| 1970 | 3 | 0.639 | 0.569 |
| 1971 | 3 | 0.626 | 0.563 |
| 1972 | 3 | 0.626 | 0.563 |
| 1973 | 3 | 0.616 | 0.558 |
| 1974 | 3 | 0.616 | 0.558 |
| 1975 | 3 | 0.779 | 0.639 |
| 1976 | 3 | 0.779 | 0.639 |
| 1977 | 7 | 1.781 | 1.641 |
| 1978 | 7 | 1.781 | 1.641 |
| 1979 | 7 | 1.717 | 1.608 |
| 1980 | 7 | 1.717 | 1.608 |
| 1981 | 2 | 0.516 | 0.508 |
| 1982 | 2 | 0.516 | 0.508 |
| 1983 | 2 | 0.578 | 0.539 |
| 1984 | 2 | 0.578 | 0.539 |
| 1985 | 2 | 0.552 | 0.526 |
| 1986 | 2 | 0.552 | 0.526 |
| 1987 | 3 | 0.643 | 0.572 |
| 1988 | 3 | 0.643 | 0.572 |
| 1989 | 3 | 0.648 | 0.574 |
| 1990 | 3 | 0.648 | 0.574 |
| 1991 | 3 | 0.674 | 0.587 |
| 1992 | 3 | 0.674 | 0.587 |
| 1993 | 7 | 1.663 | 1.582 |
| 1994 | 7 | 1.663 | 1.582 |
| 1995 | 4 | 1.449 | 1.474 |
| 1996 | 4 | 1.449 | 1.474 |
| 1997 | 4 | 1.426 | 1.463 |
| 1998 | 4 | 1.426 | 1.463 |
| 1999 | 4 | 1.435 | 1.468 |
| 2000 | 4 | 1.435 | 1.468 |
Perhaps an interesting aspect of party control is with regard to bipartisan control of the U.S. govenment. To allow such a study we define a Bipartisan Control Index (BCI):
| Control Description | BCI |
| President only of either party | 3 |
| President & Senate of same party | 2 |
| President & House of same party | 1 |
| President & House & Senate of same party | 0 |
(Back to the top of
National Debt)
(Back to Economy and Political
Parties)
(Back to Politics)