Unemployment and Political
Parties
(Back to
Politics)
(Back to Economy and Political
Parties)
(Go to data tables at
bottom.)
Update to this page.
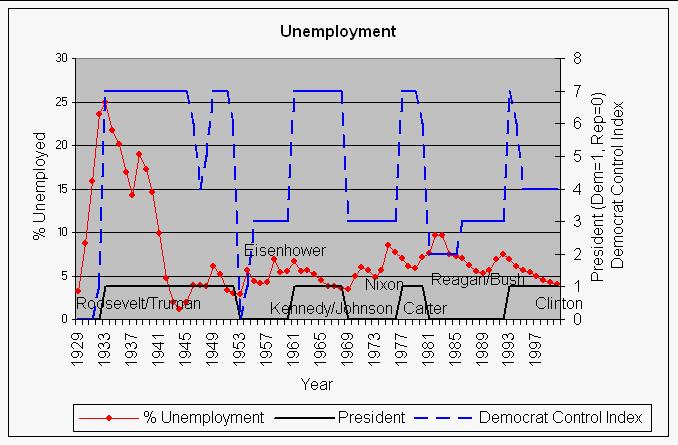 |
| This shows the U. S. unemployment data for the years 1929-2000
compared to the presidential terms (Dem=1, Rep=0) and Democratic control index
of the federal government (see below for definition). Note
the large rises in the Eisenhower, Nixon and Reagan/Bush administrations and
the falls in the Kennedy-Johnson, Carter and Clinton administrations,
especially the former and the latter. |
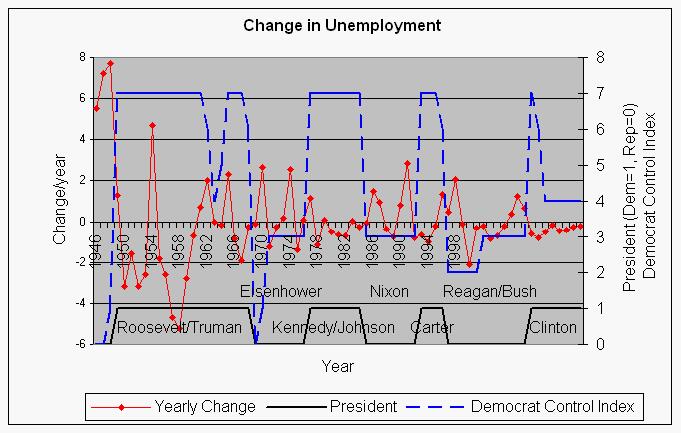 |
| This shows the unemployment change year by year for the years
1930-2000 compared to the presidential terms (Dem=1, Rep=0) and Democratic
control index of the federal government (see below for
definition). Note the large oscillations in the Eisenhower, Nixon and
Reagan/Bush administrations and the relative small changes in the
Kennedy-Johnson, Carter and Clinton administrations, especially the former and
the latter. |
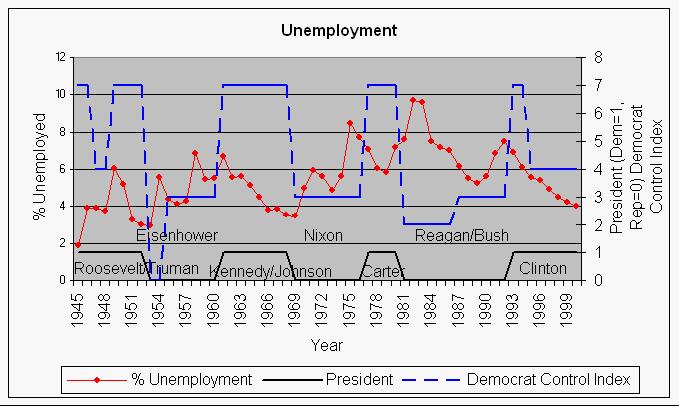 |
| This shows the U. S. unemployment data for the years 1945-2000
compared to the presidential terms (Dem=1, Rep=0) and Democratic control index
of the federal government (see below for definition). Note
the large rises in the Eisenhower, Nixon and Reagan/Bush administrations and
the falls in the Kennedy-Johnson, Carter and Clinton administrations,
especially the former and the latter. |
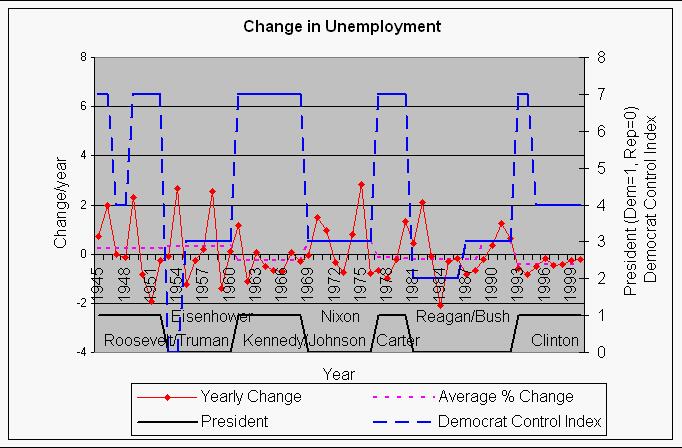 |
| This shows the unemployment change year by year for the years
1945-2000 compared to the presidential terms (Dem=1, Rep=0) and Democratic
control index of the federal government (see below for
definition). Note the large oscillations in the Eisenhower, Nixon and
Reagan/Bush administrations and the relative small negative changes in the
Kennedy-Johnson, Carter and Clinton administrations, especially the former and
the latter. |
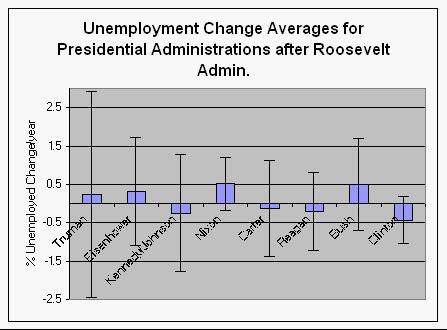 |
This shows the average change in the % unemployed for presidential
administrations after the Franklin Roosevelt administration. Standard
deviations are shown. Note the highs for Eisenhower, Nixon and Bush and the low
for Clinton. |
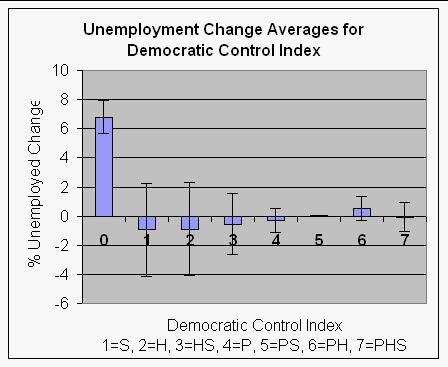 |
This shows the average change in the % unemployed for the
Democratic control index (see below for definition).
Standard deviations are shown, except for index 5 since it is for only one year
(1948) which gives an infinite standard deviation. Note the high for index 0
(Republican president, house and senate). The lowest average is for Republican
president with Democratic House, Senate or House and Senate. |
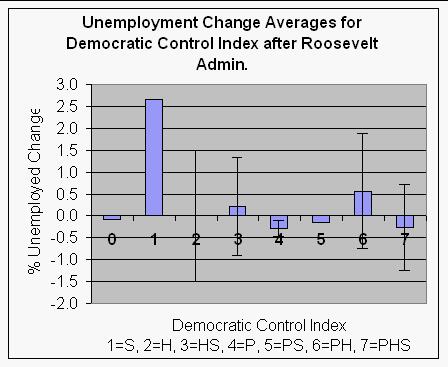 |
This shows the average change in the % unemployed for the
Democratic control index (see below for definition)
excluding the Hoover and Roosevelt administrations. Standard deviations are
shown, except for indices 0, 1 and 5 since they are for only one year each,
which gives an infinite standard deviation. Note the lows for Democratic
president (index 4) and full Democratic control (index 7). |
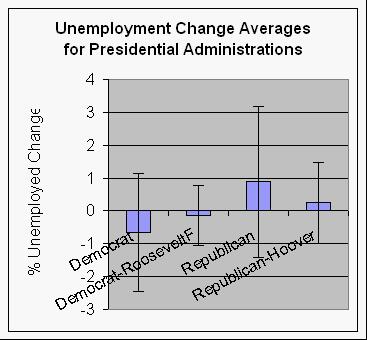 |
This shows the average change in the % unemployed plotted for
presidential administrations by political party. Standard deviations are shown.
Since the Hoover and Roosevelt admininistrations included the singular events
of the Great Depression and World War II, also shown are the administrations
without those two administrations. Note the high for Republican
admininistrations including Hoover and the low for Democratic presidents
including Roosevelt, butboth with a large standard deviation. |
The Democratic Control Index is
defined as
- 7=Democratic party has presidency and majorities in both the
Senate and House.
- 6=Democratic party has presidency and majority in the
House.
- 5=Democratic party has presidency and majority in the
Senate.
- 4=Democratic party has presidency only.
- 3=Democratic party has majority in the House and Senate, but
not the presidency.
- 2=Democratic party has majority in the House only and not the
presidency.
- 1=Democratic party has majority in the Senate only and not the
presidency.
- 0=Democratic party is in minority in both the Senate and the
House and does not have the presidency.
|
| A diagram showing the
Democratic Party Control Index: |
| Democratic Control |
Democratic Party Control
Index |
Republican Control |
| nothing |
0 |
President, House & Senate |
| Senate |
1 |
President & House |
| House |
2 |
President & Senate |
| House & Senate |
3 |
President |
| President |
4 |
House & Senate |
| President & Senate |
5 |
House |
| President & House |
6 |
Senate |
| President, House & Senate |
7 |
nothing |
The correlation coefficients for Democratic control of the Senate, House
and presidency with the change in the % unemployment are:
| Correlations |
% Unemployed Change |
|
|
| Senate Dem/Rep |
-0.26 |
| House Dem/Rep |
-0.21 |
| President Dem. |
-0.36 |
| Democratic Control Index |
-0.48 |
For administrations since Franklin Roosevelts' the correlations are:
| Correlations |
% Unemployed Change |
|
|
| Senate Dem/Rep |
-0.04 |
| House Dem/Rep |
-0.08 |
| President Dem. |
-0.18 |
| Democratic Control Index |
-0.16 |
Thus, we see that negative change in % unemployed occurs about 35% more
often when we have a Democratic president than when we have a Republican
president and about 45% more often when we have mostly Democractic control of
the govenment.
(Back to the top of
Unemployment)
(Back to Economy and Political
Parties)
(Back to Politics)
The data are found at
http://stats.bls.gov/webapps/legacy/cpsatab5.htm
and http://146.142.4.24/cgi-bin/srgate
(request report LFU21000100) and
http://www.economagic.com/em-cgi/data.exe/fedstl/unrate+2.
| U.S. Unemployment civilian labor force seasonally
adjusted |
|
|
|
|
|
|
|
|
|
|
|
|
|
|
|
|
| As a percent of the civilian labor force. |
age>=14 1929-1947; age>=16 1948-2000 |
Senate |
|
|
House |
|
|
President |
|
|
|
| Year |
Jan |
Feb |
Mar |
Apr |
May |
Jun |
Jul |
Aug |
Sep |
Oct |
Nov |
Dec |
% Unemployment |
Yearly Change |
Dem. |
Rep. |
Senate D/R |
Dem. |
Rep. |
House D/R |
Dem. |
Rep. |
Year |
|
| 1929 |
|
|
|
|
|
|
|
|
|
|
|
|
3.2 |
|
39 |
56 |
0.70 |
163 |
267 |
0.61 |
0 |
1 |
1929 |
Hoover |
| 1930 |
|
|
|
|
|
|
|
|
|
|
|
|
8.7 |
5.50 |
39 |
56 |
0.70 |
163 |
267 |
0.61 |
0 |
1 |
1930 |
Hoover |
| 1931 |
|
|
|
|
|
|
|
|
|
|
|
|
15.9 |
7.20 |
47 |
48 |
0.98 |
216 |
218 |
0.99 |
0 |
1 |
1931 |
Hoover |
| 1932 |
|
|
|
|
|
|
|
|
|
|
|
|
23.6 |
7.70 |
47 |
48 |
0.98 |
216 |
218 |
0.99 |
0 |
1 |
1932 |
Hoover |
| 1933 |
|
|
|
|
|
|
|
|
|
|
|
|
24.9 |
1.30 |
59 |
36 |
1.64 |
313 |
117 |
2.68 |
1 |
0 |
1933 |
RooseveltF |
| 1934 |
|
|
|
|
|
|
|
|
|
|
|
|
21.7 |
-3.20 |
59 |
36 |
1.64 |
313 |
117 |
2.68 |
1 |
0 |
1934 |
RooseveltF |
| 1935 |
|
|
|
|
|
|
|
|
|
|
|
|
20.1 |
-1.60 |
69 |
25 |
2.76 |
322 |
103 |
3.13 |
1 |
0 |
1935 |
RooseveltF |
| 1936 |
|
|
|
|
|
|
|
|
|
|
|
|
16.9 |
-3.20 |
69 |
25 |
2.76 |
322 |
103 |
3.13 |
1 |
0 |
1936 |
RooseveltF |
| 1937 |
|
|
|
|
|
|
|
|
|
|
|
|
14.3 |
-2.60 |
75 |
17 |
4.41 |
333 |
89 |
3.74 |
1 |
0 |
1937 |
RooseveltF |
| 1938 |
|
|
|
|
|
|
|
|
|
|
|
|
19 |
4.70 |
75 |
17 |
4.41 |
333 |
89 |
3.74 |
1 |
0 |
1938 |
RooseveltF |
| 1939 |
|
|
|
|
|
|
|
|
|
|
|
|
17.2 |
-1.80 |
69 |
23 |
3.00 |
262 |
169 |
1.55 |
1 |
0 |
1939 |
RooseveltF |
| 1940 |
|
|
|
|
|
|
|
|
|
|
|
|
14.6 |
-2.60 |
69 |
23 |
3.00 |
262 |
169 |
1.55 |
1 |
0 |
1940 |
RooseveltF |
| 1941 |
|
|
|
|
|
|
|
|
|
|
|
|
9.9 |
-4.70 |
66 |
28 |
2.36 |
267 |
162 |
1.65 |
1 |
0 |
1941 |
RooseveltF |
| 1942 |
|
|
|
|
|
|
|
|
|
|
|
|
4.7 |
-5.20 |
66 |
28 |
2.36 |
267 |
162 |
1.65 |
1 |
0 |
1942 |
RooseveltF |
| 1943 |
|
|
|
|
|
|
|
|
|
|
|
|
1.9 |
-2.80 |
57 |
38 |
1.50 |
222 |
209 |
1.06 |
1 |
0 |
1943 |
RooseveltF |
| 1944 |
|
|
|
|
|
|
|
|
|
|
|
|
1.2 |
-0.70 |
57 |
38 |
1.50 |
222 |
209 |
1.06 |
1 |
0 |
1944 |
RooseveltF |
| 1945 |
|
|
|
|
|
|
|
|
|
|
|
|
1.9 |
0.70 |
57 |
38 |
1.50 |
243 |
190 |
1.28 |
1 |
0 |
1945 |
RooseveltF/Truman |
| 1946 |
|
|
|
|
|
|
|
|
|
|
|
|
3.9 |
2.00 |
57 |
38 |
1.50 |
243 |
190 |
1.28 |
1 |
0 |
1946 |
Truman |
| 1947 |
|
|
|
|
|
|
|
|
|
|
|
|
3.9 |
0.00 |
45 |
51 |
0.88 |
188 |
246 |
0.76 |
1 |
0 |
1947 |
Truman |
| 1948 |
3.4 |
3.8 |
4 |
3.9 |
3.5 |
3.6 |
3.6 |
3.9 |
3.8 |
3.7 |
3.8 |
4 |
3.75 |
-0.15 |
45 |
51 |
0.88 |
188 |
246 |
0.76 |
1 |
0 |
1948 |
Truman |
| 1949 |
4.3 |
4.7 |
5 |
5.3 |
6.1 |
6.2 |
6.7 |
6.8 |
6.6 |
7.9 |
6.4 |
6.6 |
6.05 |
2.30 |
54 |
42 |
1.29 |
263 |
171 |
1.54 |
1 |
0 |
1949 |
Truman |
| 1950 |
6.5 |
6.4 |
6.3 |
5.8 |
5.5 |
5.4 |
5 |
4.5 |
4.4 |
4.2 |
4.2 |
4.3 |
5.21 |
-0.84 |
54 |
42 |
1.29 |
263 |
171 |
1.54 |
1 |
0 |
1950 |
Truman |
| 1951 |
3.7 |
3.4 |
3.4 |
3.1 |
3 |
3.2 |
3.1 |
3.1 |
3.3 |
3.5 |
3.5 |
3.1 |
3.28 |
-1.93 |
48 |
47 |
1.02 |
234 |
199 |
1.18 |
1 |
0 |
1951 |
Truman |
| 1952 |
3.2 |
3.1 |
2.9 |
2.9 |
3 |
3 |
3.2 |
3.4 |
3.1 |
3 |
2.8 |
2.7 |
3.03 |
-0.26 |
48 |
47 |
1.02 |
234 |
199 |
1.18 |
1 |
0 |
1952 |
Truman |
| 1953 |
2.9 |
2.6 |
2.6 |
2.7 |
2.5 |
2.5 |
2.6 |
2.7 |
2.9 |
3.1 |
3.5 |
4.5 |
2.93 |
-0.10 |
46 |
48 |
0.96 |
213 |
221 |
0.96 |
0 |
1 |
1953 |
Eisenhower |
| 1954 |
4.9 |
5.2 |
5.7 |
5.9 |
5.9 |
5.6 |
5.8 |
6 |
6.1 |
5.7 |
5.3 |
5 |
5.59 |
2.67 |
46 |
48 |
0.96 |
213 |
221 |
0.96 |
0 |
1 |
1954 |
Eisenhower |
| 1955 |
4.9 |
4.7 |
4.6 |
4.7 |
4.3 |
4.2 |
4 |
4.2 |
4.1 |
4.3 |
4.2 |
4.2 |
4.37 |
-1.23 |
48 |
47 |
1.02 |
232 |
203 |
1.14 |
0 |
1 |
1955 |
Eisenhower |
| 1956 |
4 |
3.9 |
4.2 |
4 |
4.3 |
4.3 |
4.4 |
4.1 |
3.9 |
3.9 |
4.3 |
4.2 |
4.13 |
-0.24 |
48 |
47 |
1.02 |
232 |
203 |
1.14 |
0 |
1 |
1956 |
Eisenhower |
| 1957 |
4.2 |
3.9 |
3.7 |
3.9 |
4.1 |
4.3 |
4.2 |
4.1 |
4.4 |
4.5 |
5.1 |
5.2 |
4.30 |
0.18 |
49 |
47 |
1.04 |
234 |
201 |
1.16 |
0 |
1 |
1957 |
Eisenhower |
| 1958 |
5.8 |
6.4 |
6.7 |
7.4 |
7.4 |
7.3 |
7.5 |
7.4 |
7.1 |
6.7 |
6.2 |
6.2 |
6.84 |
2.54 |
49 |
47 |
1.04 |
234 |
201 |
1.16 |
0 |
1 |
1958 |
Eisenhower |
| 1959 |
6 |
5.9 |
5.6 |
5.2 |
5.1 |
5 |
5.1 |
5.2 |
5.5 |
5.7 |
5.8 |
5.3 |
5.45 |
-1.39 |
64 |
34 |
1.88 |
283 |
153 |
1.85 |
0 |
1 |
1959 |
Eisenhower |
| 1960 |
5.2 |
4.8 |
5.4 |
5.2 |
5.1 |
5.4 |
5.5 |
5.6 |
5.5 |
6.1 |
6.1 |
6.6 |
5.54 |
0.09 |
64 |
34 |
1.88 |
283 |
153 |
1.85 |
0 |
1 |
1960 |
Eisenhower |
| 1961 |
6.6 |
6.9 |
6.9 |
7 |
7.1 |
6.9 |
7 |
6.6 |
6.7 |
6.5 |
6.1 |
6 |
6.69 |
1.15 |
64 |
36 |
1.78 |
262 |
175 |
1.50 |
1 |
0 |
1961 |
Kennedy |
| 1962 |
5.8 |
5.5 |
5.6 |
5.6 |
5.5 |
5.5 |
5.4 |
5.7 |
5.6 |
5.4 |
5.7 |
5.5 |
5.57 |
-1.13 |
64 |
36 |
1.78 |
262 |
175 |
1.50 |
1 |
0 |
1962 |
Kennedy/Johnson |
| 1963 |
5.7 |
5.9 |
5.7 |
5.7 |
5.9 |
5.6 |
5.6 |
5.4 |
5.5 |
5.5 |
5.7 |
5.5 |
5.64 |
0.07 |
67 |
33 |
2.03 |
258 |
176 |
1.47 |
1 |
0 |
1963 |
Johnson |
| 1964 |
5.6 |
5.4 |
5.4 |
5.3 |
5.1 |
5.2 |
4.9 |
5 |
5.1 |
5.1 |
4.8 |
5 |
5.16 |
-0.48 |
67 |
33 |
2.03 |
258 |
176 |
1.47 |
1 |
0 |
1964 |
Johnson |
| 1965 |
4.9 |
5.1 |
4.7 |
4.8 |
4.6 |
4.6 |
4.4 |
4.4 |
4.3 |
4.2 |
4.1 |
4 |
4.51 |
-0.65 |
68 |
32 |
2.13 |
295 |
140 |
2.11 |
1 |
0 |
1965 |
Johnson |
| 1966 |
4 |
3.8 |
3.8 |
3.8 |
3.9 |
3.8 |
3.8 |
3.8 |
3.7 |
3.7 |
3.6 |
3.8 |
3.79 |
-0.72 |
68 |
32 |
2.13 |
295 |
140 |
2.11 |
1 |
0 |
1966 |
Johnson |
| 1967 |
3.9 |
3.8 |
3.8 |
3.8 |
3.8 |
3.9 |
3.8 |
3.8 |
3.8 |
4 |
3.9 |
3.8 |
3.84 |
0.05 |
64 |
36 |
1.78 |
248 |
187 |
1.33 |
1 |
0 |
1967 |
Johnson |
| 1968 |
3.7 |
3.8 |
3.7 |
3.5 |
3.5 |
3.7 |
3.7 |
3.5 |
3.4 |
3.4 |
3.4 |
3.4 |
3.56 |
-0.28 |
64 |
36 |
1.78 |
248 |
187 |
1.33 |
1 |
0 |
1968 |
Johnson |
| 1969 |
3.4 |
3.4 |
3.4 |
3.4 |
3.4 |
3.5 |
3.5 |
3.5 |
3.7 |
3.7 |
3.5 |
3.5 |
3.49 |
-0.07 |
58 |
42 |
1.38 |
243 |
192 |
1.27 |
0 |
1 |
1969 |
Nixon |
| 1970 |
3.9 |
4.2 |
4.4 |
4.6 |
4.8 |
4.9 |
5 |
5.1 |
5.4 |
5.5 |
5.9 |
6.1 |
4.98 |
1.49 |
58 |
42 |
1.38 |
243 |
192 |
1.27 |
0 |
1 |
1970 |
Nixon |
| 1971 |
5.9 |
5.9 |
6 |
5.9 |
5.9 |
5.9 |
6 |
6.1 |
6 |
5.8 |
6 |
6 |
5.95 |
0.97 |
54 |
44 |
1.23 |
255 |
180 |
1.42 |
0 |
1 |
1971 |
Nixon |
| 1972 |
5.8 |
5.7 |
5.8 |
5.7 |
5.7 |
5.7 |
5.6 |
5.6 |
5.5 |
5.6 |
5.3 |
5.2 |
5.60 |
-0.35 |
54 |
44 |
1.23 |
255 |
180 |
1.42 |
0 |
1 |
1972 |
Nixon |
| 1973 |
4.9 |
5 |
4.9 |
5 |
4.9 |
4.9 |
4.8 |
4.8 |
4.8 |
4.6 |
4.8 |
4.9 |
4.86 |
-0.74 |
56 |
42 |
1.33 |
242 |
192 |
1.26 |
0 |
1 |
1973 |
Nixon |
| 1974 |
5.1 |
5.2 |
5.1 |
5.1 |
5.1 |
5.4 |
5.5 |
5.5 |
5.9 |
6 |
6.6 |
7.2 |
5.64 |
0.78 |
56 |
42 |
1.33 |
242 |
192 |
1.26 |
0 |
1 |
1974 |
Nixon |
| 1975 |
8.1 |
8.1 |
8.6 |
8.8 |
9 |
8.8 |
8.6 |
8.4 |
8.4 |
8.4 |
8.3 |
8.2 |
8.48 |
2.83 |
61 |
37 |
1.65 |
291 |
144 |
2.02 |
0 |
1 |
1975 |
Nixon |
| 1976 |
7.9 |
7.7 |
7.6 |
7.7 |
7.4 |
7.6 |
7.8 |
7.8 |
7.6 |
7.7 |
7.8 |
7.8 |
7.70 |
-0.78 |
61 |
37 |
1.65 |
291 |
144 |
2.02 |
0 |
1 |
1976 |
Nixon |
| 1977 |
7.5 |
7.6 |
7.4 |
7.2 |
7 |
7.2 |
6.9 |
7 |
6.8 |
6.8 |
6.8 |
6.4 |
7.05 |
-0.65 |
61 |
38 |
1.61 |
292 |
143 |
2.04 |
1 |
0 |
1977 |
Carter |
| 1978 |
6.4 |
6.3 |
6.3 |
6.1 |
6 |
5.9 |
6.2 |
5.9 |
6 |
5.8 |
5.9 |
6 |
6.07 |
-0.98 |
61 |
38 |
1.61 |
292 |
143 |
2.04 |
1 |
0 |
1978 |
Carter |
| 1979 |
5.9 |
5.9 |
5.8 |
5.8 |
5.6 |
5.7 |
5.7 |
6 |
5.9 |
6 |
5.9 |
6 |
5.85 |
-0.22 |
58 |
41 |
1.41 |
277 |
158 |
1.75 |
1 |
0 |
1979 |
Carter |
| 1980 |
6.3 |
6.3 |
6.3 |
6.9 |
7.5 |
7.6 |
7.8 |
7.7 |
7.5 |
7.5 |
7.5 |
7.2 |
7.18 |
1.33 |
58 |
41 |
1.41 |
277 |
158 |
1.75 |
1 |
0 |
1980 |
Carter |
| 1981 |
7.5 |
7.4 |
7.4 |
7.2 |
7.5 |
7.5 |
7.2 |
7.4 |
7.6 |
7.9 |
8.3 |
8.5 |
7.62 |
0.44 |
46 |
53 |
0.87 |
242 |
192 |
1.26 |
0 |
1 |
1981 |
Reagan |
| 1982 |
8.6 |
8.9 |
9 |
9.3 |
9.4 |
9.6 |
9.8 |
9.8 |
10.1 |
10.4 |
10.8 |
10.8 |
9.71 |
2.09 |
46 |
53 |
0.87 |
242 |
192 |
1.26 |
0 |
1 |
1982 |
Reagan |
| 1983 |
10.4 |
10.4 |
10.3 |
10.2 |
10.1 |
10.1 |
9.4 |
9.5 |
9.2 |
8.8 |
8.5 |
8.3 |
9.60 |
-0.11 |
46 |
54 |
0.85 |
269 |
166 |
1.62 |
0 |
1 |
1983 |
Reagan |
| 1984 |
8 |
7.8 |
7.8 |
7.7 |
7.4 |
7.2 |
7.5 |
7.5 |
7.3 |
7.4 |
7.2 |
7.3 |
7.51 |
-2.09 |
46 |
54 |
0.85 |
269 |
166 |
1.62 |
0 |
1 |
1984 |
Reagan |
| 1985 |
7.3 |
7.2 |
7.2 |
7.3 |
7.2 |
7.4 |
7.4 |
7.1 |
7.1 |
7.1 |
7 |
7 |
7.19 |
-0.32 |
47 |
53 |
0.89 |
253 |
182 |
1.39 |
0 |
1 |
1985 |
Reagan |
| 1986 |
6.7 |
7.2 |
7.2 |
7.1 |
7.2 |
7.2 |
7 |
6.9 |
7 |
7 |
6.9 |
6.6 |
7.00 |
-0.19 |
47 |
53 |
0.89 |
253 |
182 |
1.39 |
0 |
1 |
1986 |
Reagan |
| 1987 |
6.6 |
6.6 |
6.6 |
6.3 |
6.3 |
6.2 |
6.1 |
6 |
5.9 |
6 |
5.8 |
5.7 |
6.18 |
-0.82 |
55 |
45 |
1.22 |
258 |
177 |
1.46 |
0 |
1 |
1987 |
Reagan |
| 1988 |
5.7 |
5.7 |
5.7 |
5.4 |
5.6 |
5.4 |
5.4 |
5.6 |
5.4 |
5.4 |
5.3 |
5.3 |
5.49 |
-0.68 |
55 |
45 |
1.22 |
258 |
177 |
1.46 |
0 |
1 |
1988 |
Reagan |
| 1989 |
5.4 |
5.2 |
5 |
5.2 |
5.2 |
5.3 |
5.2 |
5.2 |
5.3 |
5.3 |
5.4 |
5.4 |
5.26 |
-0.23 |
55 |
45 |
1.22 |
260 |
175 |
1.49 |
0 |
1 |
1989 |
Bush |
| 1990 |
5.4 |
5.3 |
5.2 |
5.4 |
5.4 |
5.2 |
5.5 |
5.7 |
5.9 |
5.9 |
6.2 |
6.3 |
5.62 |
0.36 |
55 |
45 |
1.22 |
260 |
175 |
1.49 |
0 |
1 |
1990 |
Bush |
| 1991 |
6.4 |
6.6 |
6.8 |
6.7 |
6.9 |
6.9 |
6.8 |
6.9 |
6.9 |
7 |
7 |
7.3 |
6.85 |
1.23 |
56 |
44 |
1.27 |
267 |
167 |
1.60 |
0 |
1 |
1991 |
Bush |
| 1992 |
7.3 |
7.4 |
7.4 |
7.4 |
7.6 |
7.8 |
7.7 |
7.6 |
7.6 |
7.3 |
7.4 |
7.4 |
7.49 |
0.64 |
56 |
44 |
1.27 |
267 |
167 |
1.60 |
0 |
1 |
1992 |
Bush |
| 1993 |
7.3 |
7.1 |
7 |
7.1 |
7.1 |
7 |
6.9 |
6.8 |
6.7 |
6.8 |
6.6 |
6.5 |
6.91 |
-0.58 |
57 |
43 |
1.33 |
258 |
176 |
1.47 |
1 |
0 |
1993 |
Clinton |
| 1994 |
6.6 |
6.6 |
6.5 |
6.4 |
6.1 |
6.1 |
6.1 |
6 |
5.9 |
5.8 |
5.6 |
5.5 |
6.10 |
-0.81 |
57 |
43 |
1.33 |
258 |
176 |
1.47 |
1 |
0 |
1994 |
Clinton |
| 1995 |
5.6 |
5.4 |
5.4 |
5.8 |
5.6 |
5.6 |
5.7 |
5.7 |
5.6 |
5.5 |
5.6 |
5.6 |
5.59 |
-0.51 |
48 |
52 |
0.92 |
204 |
230 |
0.89 |
1 |
0 |
1995 |
Clinton |
| 1996 |
5.7 |
5.5 |
5.5 |
5.5 |
5.6 |
5.3 |
5.5 |
5.1 |
5.2 |
5.2 |
5.4 |
5.4 |
5.41 |
-0.18 |
48 |
52 |
0.92 |
204 |
230 |
0.89 |
1 |
0 |
1996 |
Clinton |
| 1997 |
5.3 |
5.3 |
5.2 |
5 |
4.9 |
5 |
4.8 |
4.8 |
4.9 |
4.7 |
4.6 |
4.7 |
4.93 |
-0.48 |
45 |
52 |
0.87 |
207 |
226 |
0.92 |
1 |
0 |
1997 |
Clinton |
| 1998 |
4.7 |
4.6 |
4.7 |
4.3 |
4.4 |
4.5 |
4.5 |
4.5 |
4.5 |
4.5 |
4.4 |
4.4 |
4.50 |
-0.43 |
45 |
52 |
0.87 |
207 |
226 |
0.92 |
1 |
0 |
1998 |
Clinton |
| 1999 |
4.3 |
4.4 |
4.2 |
4.3 |
4.2 |
4.3 |
4.3 |
4.2 |
4.2 |
4.1 |
4.1 |
4.1 |
4.23 |
-0.27 |
45 |
52 |
0.87 |
211 |
223 |
0.95 |
1 |
0 |
1999 |
Clinton |
| 2000 |
4 |
4.1 |
4.1 |
3.9 |
4.1 |
4 |
4 |
4.1 |
3.9 |
3.9 |
|
|
4.01 |
-0.22 |
45 |
52 |
0.87 |
211 |
223 |
0.95 |
1 |
0 |
2000 |
Clinton |
(Back to top of data tables)
(Back to
the top of Unemployment)
(Back to Economy and
Political Parties)
(Back to
Politics) |