Gross Domestic Product and Political
Parties
(Back to
Politics)
(Back to Economy and Political
Parties)
(Go to data table at
bottom.)
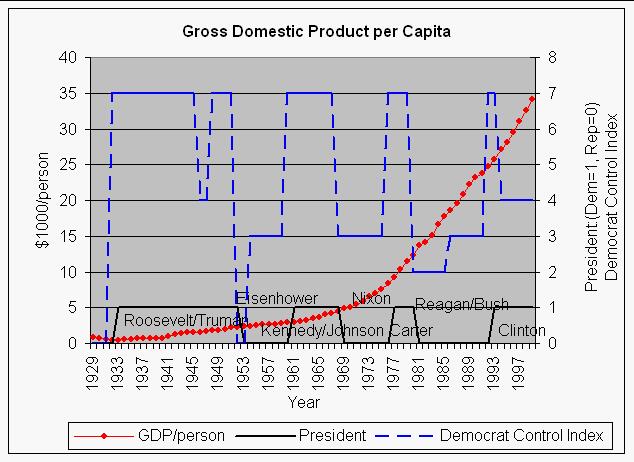 |
| This shows the U. S. gross domestic product per capita data for the
years 1929-1999 compared to the presidential terms (Dem=1, Rep=0) and
Democratic control index of the federal government (see below
for definition). |
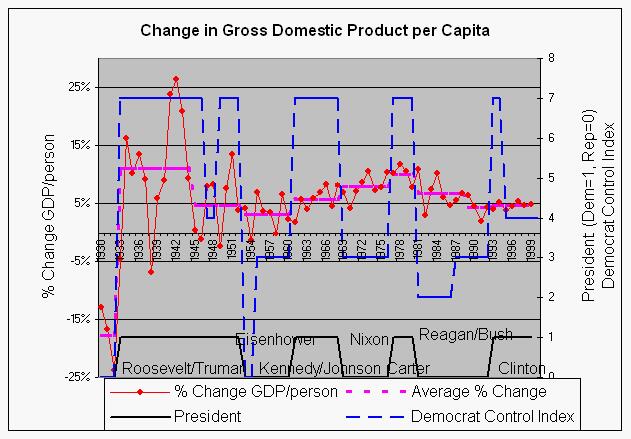 |
| This shows the GDP per capita % change year by year for the years
1929-1999 compared to presidential terms (Dem=1, Rep=0) and the Democratic
control index of the federal government (see below for
definition). The averages for each presidential administration are shown.
Note the slow down and large oscillations in the Reagan/Bush
administrations. |
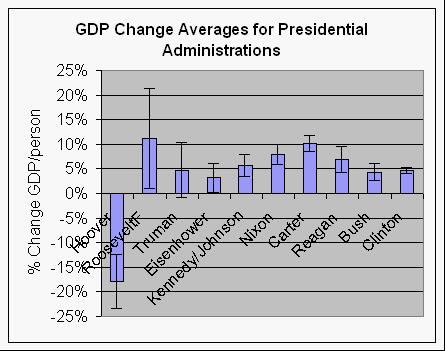 |
This shows the average % change in the GDP per capita for
presidential administrations. Standard deviations are shown. Note the lows for
Eisenhower and Bush and the high for Carter with a small standard
deviation. |
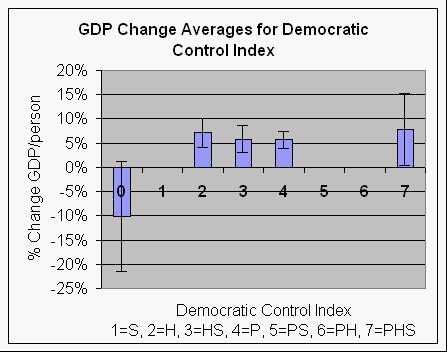 |
This shows the average % change in the GDP per capita for the
Democratic control index (see below for definition).
Standard deviations are shown. Note the low for index 0 (Republican president,
house and senate). The highest average is for full Democratic control (index 7)
with a large standard deviation. |
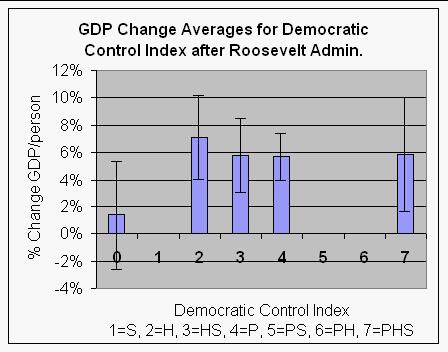 |
This shows the average % change in the GDP per capita for the
Democratic control index (see below for definition)
excluding the Hoover and Roosevelt administrations, since the Hoover and
Roosevelt admininistrations included the singular events of the Great
Depression and World War II. Standard deviations are shown. Note the low for
index 0 (Republican president, house and senate). The highest average is for
index 2, which is for Republican control of president and House, but not the
Senate. |
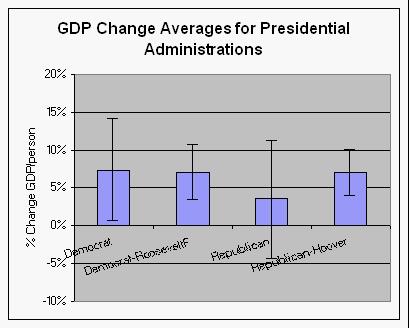 |
This shows the average % change in the GDP plotted for presidential
administrations by political party. Standard deviations are shown. Since the
Hoover and Roosevelt admininistrations included the singular events of the
Great Depression and World War II, also shown are the administrations without
those two administrations. Note the low for Republican admininistrations
including Hoover and the high for Democratic presidents including Roosevelt,
but both with a large standard deviation. Without the Hoover and Roosevelt
administrations, the Democrats are slightly higher than the Republicans. |
The correlation coefficients for Democratic control of the Senate, House
and presidency with the % change in GDP are:
| Correlations |
GDP % Change |
|
|
| Senate Dem/Rep |
0.19 |
| House Dem/Rep |
0.18 |
| President Dem. |
0.27 |
| Democratic Control Index |
0.41 |
Thus, we see that postive change in GDP occurs about 27% more often when
we have a Democratic president than when we have a Republican president and
about 41% more often when we have mostly Democractic control of the govenment.
These correlations are mostly due to the Hoover and the Franklin Roosevelt
administrations.
The correlations for political party control since the Franklin
Roosevelt administration are practically nil.
The Democratic Control Index is
defined as
- 7=Democratic party has presidency and majorities in both the
Senate and House.
- 6=Democratic party has presidency and majority in the
House.
- 5=Democratic party has presidency and majority in the
Senate.
- 4=Democratic party has presidency only.
- 3=Democratic party has majority in the House and Senate, but
not the presidency.
- 2=Democratic party has majority in the House only and not the
presidency.
- 1=Democratic party has majority in the Senate only and not the
presidency.
- 0=Democratic party is in minority in both the Senate and the
House and does not have the presidency.
|
| A diagram showing the
Democratic Party Control Index: |
| Democratic Control |
Democratic Party Control
Index |
Republican Control |
| nothing |
0 |
President, House & Senate |
| Senate |
1 |
President & House |
| House |
2 |
President & Senate |
| House & Senate |
3 |
President |
| President |
4 |
House & Senate |
| President & Senate |
5 |
House |
| President & House |
6 |
Senate |
| President, House & Senate |
7 |
nothing |
(Back to the top of Gross
Domestic Product)
(Back to Economy and Political
Parties)
(Back to Politics)
These data are found at
http://www.bea.doc.gov/bea/dn/st-tabs.htm .
|
(Billion $) |
|
million people |
$1000/person |
|
Senate |
|
|
House |
|
|
President |
|
|
|
|
| Year |
GDP |
% GDP Change |
Population |
GDP/person |
% Change GDP/person |
Dem. |
Rep. |
Senate Dem/Rep |
Dem. |
Rep. |
House Dem/Rep |
President Dem. |
Democrat Control Index |
Year |
President |
Average % Change |
| 1929 |
103.7 |
|
121.77 |
0.85 |
|
39 |
56 |
0.70 |
163 |
267 |
0.61 |
0 |
0 |
1929 |
Hoover |
-17.79% |
| 1930 |
91.3 |
-11.96% |
123.08 |
0.74 |
-12.89% |
39 |
56 |
0.70 |
163 |
267 |
0.61 |
0 |
0 |
1930 |
Hoover |
-17.79% |
| 1931 |
76.6 |
-16.10% |
124.04 |
0.62 |
-16.75% |
47 |
48 |
0.98 |
216 |
218 |
0.99 |
0 |
0 |
1931 |
Hoover |
-17.79% |
| 1932 |
58.8 |
-23.24% |
124.84 |
0.47 |
-23.73% |
47 |
48 |
0.98 |
216 |
218 |
0.99 |
0 |
0 |
1932 |
Hoover |
-17.79% |
| 1933 |
56.4 |
-4.08% |
125.58 |
0.45 |
-4.65% |
59 |
36 |
1.64 |
313 |
117 |
2.68 |
1 |
7 |
1933 |
RooseveltF |
11.09% |
| 1934 |
66 |
17.02% |
126.37 |
0.52 |
16.29% |
59 |
36 |
1.64 |
313 |
117 |
2.68 |
1 |
7 |
1934 |
RooseveltF |
11.09% |
| 1935 |
73.3 |
11.06% |
127.25 |
0.58 |
10.30% |
69 |
25 |
2.76 |
322 |
103 |
3.13 |
1 |
7 |
1935 |
RooseveltF |
11.09% |
| 1936 |
83.7 |
14.19% |
128.05 |
0.65 |
13.47% |
69 |
25 |
2.76 |
322 |
103 |
3.13 |
1 |
7 |
1936 |
RooseveltF |
11.09% |
| 1937 |
91.9 |
9.80% |
128.82 |
0.71 |
9.14% |
75 |
17 |
4.41 |
333 |
89 |
3.74 |
1 |
7 |
1937 |
RooseveltF |
11.09% |
| 1938 |
86.1 |
-6.31% |
129.82 |
0.66 |
-7.03% |
75 |
17 |
4.41 |
333 |
89 |
3.74 |
1 |
7 |
1938 |
RooseveltF |
11.09% |
| 1939 |
92 |
6.85% |
130.88 |
0.70 |
5.99% |
69 |
23 |
3.00 |
262 |
169 |
1.55 |
1 |
7 |
1939 |
RooseveltF |
11.09% |
| 1940 |
101.3 |
10.11% |
132.12 |
0.77 |
9.07% |
69 |
23 |
3.00 |
262 |
169 |
1.55 |
1 |
7 |
1940 |
RooseveltF |
11.09% |
| 1941 |
126.7 |
25.07% |
133.40 |
0.95 |
23.87% |
66 |
28 |
2.36 |
267 |
162 |
1.65 |
1 |
7 |
1941 |
RooseveltF |
11.09% |
| 1942 |
161.8 |
27.70% |
134.86 |
1.20 |
26.32% |
66 |
28 |
2.36 |
267 |
162 |
1.65 |
1 |
7 |
1942 |
RooseveltF |
11.09% |
| 1943 |
198.4 |
22.62% |
136.74 |
1.45 |
20.93% |
57 |
38 |
1.50 |
222 |
209 |
1.06 |
1 |
7 |
1943 |
RooseveltF |
11.09% |
| 1944 |
219.7 |
10.74% |
138.40 |
1.59 |
9.41% |
57 |
38 |
1.50 |
222 |
209 |
1.06 |
1 |
7 |
1944 |
RooseveltF |
11.09% |
| 1945 |
223 |
1.50% |
139.93 |
1.59 |
0.39% |
57 |
38 |
1.50 |
243 |
190 |
1.28 |
1 |
7 |
1945 |
RooseveltF/Truman |
4.74% |
| 1946 |
222.3 |
-0.31% |
141.39 |
1.57 |
-1.34% |
57 |
38 |
1.50 |
243 |
190 |
1.28 |
1 |
7 |
1946 |
Truman |
4.74% |
| 1947 |
244.4 |
9.94% |
144.03 |
1.70 |
7.93% |
45 |
51 |
0.88 |
188 |
246 |
0.76 |
1 |
4 |
1947 |
Truman |
4.74% |
| 1948 |
269.6 |
10.31% |
146.63 |
1.84 |
8.35% |
45 |
51 |
0.88 |
188 |
246 |
0.76 |
1 |
4 |
1948 |
Truman |
4.74% |
| 1949 |
267.7 |
-0.70% |
149.19 |
1.79 |
-2.41% |
54 |
42 |
1.29 |
263 |
171 |
1.54 |
1 |
7 |
1949 |
Truman |
4.74% |
| 1950 |
294.3 |
9.94% |
152.27 |
1.93 |
7.71% |
54 |
42 |
1.29 |
263 |
171 |
1.54 |
1 |
7 |
1950 |
Truman |
4.74% |
| 1951 |
339.5 |
15.36% |
154.88 |
2.19 |
13.42% |
48 |
47 |
1.02 |
234 |
199 |
1.18 |
1 |
7 |
1951 |
Truman |
4.74% |
| 1952 |
358.6 |
5.63% |
157.55 |
2.28 |
3.83% |
48 |
47 |
1.02 |
234 |
199 |
1.18 |
1 |
7 |
1952 |
Truman |
4.74% |
| 1953 |
379.9 |
5.94% |
160.18 |
2.37 |
4.20% |
46 |
48 |
0.96 |
213 |
221 |
0.96 |
0 |
0 |
1953 |
Eisenhower |
3.20% |
| 1954 |
381.1 |
0.32% |
163.03 |
2.34 |
-1.43% |
46 |
48 |
0.96 |
213 |
221 |
0.96 |
0 |
0 |
1954 |
Eisenhower |
3.20% |
| 1955 |
415.2 |
8.95% |
165.93 |
2.50 |
7.04% |
48 |
47 |
1.02 |
232 |
203 |
1.14 |
0 |
3 |
1955 |
Eisenhower |
3.20% |
| 1956 |
438 |
5.49% |
168.90 |
2.59 |
3.64% |
48 |
47 |
1.02 |
232 |
203 |
1.14 |
0 |
3 |
1956 |
Eisenhower |
3.20% |
| 1957 |
461.5 |
5.37% |
171.98 |
2.68 |
3.48% |
49 |
47 |
1.04 |
234 |
201 |
1.16 |
0 |
3 |
1957 |
Eisenhower |
3.20% |
| 1958 |
467.9 |
1.39% |
174.88 |
2.68 |
-0.29% |
49 |
47 |
1.04 |
234 |
201 |
1.16 |
0 |
3 |
1958 |
Eisenhower |
3.20% |
| 1959 |
507.4 |
8.44% |
177.83 |
2.85 |
6.64% |
64 |
34 |
1.88 |
283 |
153 |
1.85 |
0 |
3 |
1959 |
Eisenhower |
3.20% |
| 1960 |
527.4 |
3.94% |
180.67 |
2.92 |
2.31% |
64 |
34 |
1.88 |
283 |
153 |
1.85 |
0 |
3 |
1960 |
Eisenhower |
3.20% |
| 1961 |
545.7 |
3.47% |
183.69 |
2.97 |
1.77% |
64 |
36 |
1.78 |
262 |
175 |
1.50 |
1 |
7 |
1961 |
Kennedy |
5.70% |
| 1962 |
586.5 |
7.48% |
186.54 |
3.14 |
5.84% |
64 |
36 |
1.78 |
262 |
175 |
1.50 |
1 |
7 |
1962 |
Kennedy/Johnson |
5.70% |
| 1963 |
618.7 |
5.49% |
189.24 |
3.27 |
3.98% |
67 |
33 |
2.03 |
258 |
176 |
1.47 |
1 |
7 |
1963 |
Johnson |
5.70% |
| 1964 |
664.4 |
7.39% |
191.89 |
3.46 |
5.91% |
67 |
33 |
2.03 |
258 |
176 |
1.47 |
1 |
7 |
1964 |
Johnson |
5.70% |
| 1965 |
720.1 |
8.38% |
194.30 |
3.71 |
7.04% |
68 |
32 |
2.13 |
295 |
140 |
2.11 |
1 |
7 |
1965 |
Johnson |
5.70% |
| 1966 |
789.3 |
9.61% |
196.56 |
4.02 |
8.35% |
68 |
32 |
2.13 |
295 |
140 |
2.11 |
1 |
7 |
1966 |
Johnson |
5.70% |
| 1967 |
834.1 |
5.68% |
198.71 |
4.20 |
4.53% |
64 |
36 |
1.78 |
248 |
187 |
1.33 |
1 |
7 |
1967 |
Johnson |
5.70% |
| 1968 |
911.5 |
9.28% |
200.71 |
4.54 |
8.19% |
64 |
36 |
1.78 |
248 |
187 |
1.33 |
1 |
7 |
1968 |
Johnson |
5.70% |
| 1969 |
985.3 |
8.10% |
202.68 |
4.86 |
7.05% |
58 |
42 |
1.38 |
243 |
192 |
1.27 |
0 |
3 |
1969 |
Nixon |
7.95% |
| 1970 |
1039.7 |
5.52% |
205.05 |
5.07 |
4.30% |
58 |
42 |
1.38 |
243 |
192 |
1.27 |
0 |
3 |
1970 |
Nixon |
7.95% |
| 1971 |
1128.6 |
8.55% |
207.66 |
5.43 |
7.19% |
54 |
44 |
1.23 |
255 |
180 |
1.42 |
0 |
3 |
1971 |
Nixon |
7.95% |
| 1972 |
1240.4 |
9.91% |
209.90 |
5.91 |
8.74% |
54 |
44 |
1.23 |
255 |
180 |
1.42 |
0 |
3 |
1972 |
Nixon |
7.95% |
| 1973 |
1385.5 |
11.70% |
211.91 |
6.54 |
10.64% |
56 |
42 |
1.33 |
242 |
192 |
1.26 |
0 |
3 |
1973 |
Nixon |
7.95% |
| 1974 |
1501 |
8.34% |
213.85 |
7.02 |
7.35% |
56 |
42 |
1.33 |
242 |
192 |
1.26 |
0 |
3 |
1974 |
Nixon |
7.95% |
| 1975 |
1635.2 |
8.94% |
215.97 |
7.57 |
7.87% |
61 |
37 |
1.65 |
291 |
144 |
2.02 |
0 |
3 |
1975 |
Nixon |
7.95% |
| 1976 |
1823.9 |
11.54% |
218.04 |
8.37 |
10.49% |
61 |
37 |
1.65 |
291 |
144 |
2.02 |
0 |
3 |
1976 |
Nixon |
7.95% |
| 1977 |
2031.4 |
11.38% |
220.24 |
9.22 |
10.26% |
61 |
38 |
1.61 |
292 |
143 |
2.04 |
1 |
7 |
1977 |
Carter |
10.13% |
| 1978 |
2295.9 |
13.02% |
222.58 |
10.31 |
11.83% |
61 |
38 |
1.61 |
292 |
143 |
2.04 |
1 |
7 |
1978 |
Carter |
10.13% |
| 1979 |
2566.4 |
11.78% |
225.06 |
11.40 |
10.55% |
58 |
41 |
1.41 |
277 |
158 |
1.75 |
1 |
7 |
1979 |
Carter |
10.13% |
| 1980 |
2795.6 |
8.93% |
227.22 |
12.30 |
7.89% |
58 |
41 |
1.41 |
277 |
158 |
1.75 |
1 |
7 |
1980 |
Carter |
10.13% |
| 1981 |
3131.3 |
12.01% |
229.47 |
13.65 |
10.91% |
46 |
53 |
0.87 |
242 |
192 |
1.26 |
0 |
2 |
1981 |
Reagan |
6.87% |
| 1982 |
3259.2 |
4.08% |
231.66 |
14.07 |
3.10% |
46 |
53 |
0.87 |
242 |
192 |
1.26 |
0 |
2 |
1982 |
Reagan |
6.87% |
| 1983 |
3534.9 |
8.46% |
233.79 |
15.12 |
7.47% |
46 |
54 |
0.85 |
269 |
166 |
1.62 |
0 |
2 |
1983 |
Reagan |
6.87% |
| 1984 |
3932.7 |
11.25% |
235.82 |
16.68 |
10.29% |
46 |
54 |
0.85 |
269 |
166 |
1.62 |
0 |
2 |
1984 |
Reagan |
6.87% |
| 1985 |
4213 |
7.13% |
237.92 |
17.71 |
6.18% |
47 |
53 |
0.89 |
253 |
182 |
1.39 |
0 |
2 |
1985 |
Reagan |
6.87% |
| 1986 |
4452.9 |
5.69% |
240.13 |
18.54 |
4.72% |
47 |
53 |
0.89 |
253 |
182 |
1.39 |
0 |
2 |
1986 |
Reagan |
6.87% |
| 1987 |
4742.5 |
6.50% |
242.29 |
19.57 |
5.56% |
55 |
45 |
1.22 |
258 |
177 |
1.46 |
0 |
3 |
1987 |
Reagan |
6.87% |
| 1988 |
5108.3 |
7.71% |
244.50 |
20.89 |
6.74% |
55 |
45 |
1.22 |
258 |
177 |
1.46 |
0 |
3 |
1988 |
Reagan |
6.87% |
| 1989 |
5489.1 |
7.45% |
246.82 |
22.24 |
6.44% |
55 |
45 |
1.22 |
260 |
175 |
1.49 |
0 |
3 |
1989 |
Bush |
4.37% |
| 1990 |
5803.2 |
5.72% |
249.46 |
23.26 |
4.60% |
55 |
45 |
1.22 |
260 |
175 |
1.49 |
0 |
3 |
1990 |
Bush |
4.37% |
| 1991 |
5986.2 |
3.15% |
252.15 |
23.74 |
2.05% |
56 |
44 |
1.27 |
267 |
167 |
1.60 |
0 |
3 |
1991 |
Bush |
4.37% |
| 1992 |
6318.9 |
5.56% |
255.03 |
24.78 |
4.37% |
56 |
44 |
1.27 |
267 |
167 |
1.60 |
0 |
3 |
1992 |
Bush |
4.37% |
| 1993 |
6642.3 |
5.12% |
257.78 |
25.77 |
4.00% |
57 |
43 |
1.33 |
258 |
176 |
1.47 |
1 |
7 |
1993 |
Clinton |
4.67% |
| 1994 |
7054.3 |
6.20% |
260.33 |
27.10 |
5.16% |
57 |
43 |
1.33 |
258 |
176 |
1.47 |
1 |
7 |
1994 |
Clinton |
4.67% |
| 1995 |
7400.5 |
4.91% |
262.80 |
28.16 |
3.92% |
48 |
52 |
0.92 |
204 |
230 |
0.89 |
1 |
4 |
1995 |
Clinton |
4.67% |
| 1996 |
7813.2 |
5.58% |
265.23 |
29.46 |
4.61% |
48 |
52 |
0.92 |
204 |
230 |
0.89 |
1 |
4 |
1996 |
Clinton |
4.67% |
| 1997 |
8318.4 |
6.47% |
267.78 |
31.06 |
5.45% |
45 |
52 |
0.87 |
207 |
226 |
0.92 |
1 |
4 |
1997 |
Clinton |
4.67% |
| 1998 |
8790.2 |
5.67% |
270.25 |
32.53 |
4.71% |
45 |
52 |
0.87 |
207 |
226 |
0.92 |
1 |
4 |
1998 |
Clinton |
4.67% |
| 1999 |
9299.2 |
5.79% |
272.69 |
34.10 |
4.84% |
45 |
52 |
0.87 |
211 |
223 |
0.95 |
1 |
4 |
1999 |
Clinton |
4.67% |
| 2000 |
|
|
277.00 |
|
|
45 |
52 |
0.87 |
211 |
223 |
0.95 |
1 |
4 |
2000 |
Clinton |
|
| Year |
GDP |
% GDP Change |
Population |
GDP/person |
% Change GDP/person |
Dem. |
Rep. |
Senate Dem/Rep |
Dem. |
Rep. |
House Dem/Rep |
President Dem. |
Democrat Control Index |
Year |
President |
Average % Change |
(Back to the top of Gross
Domestic Product)
(Back to Economy and Political
Parties)
(Back to Politics)