(Back to
Politics)
(Back to Economy and Political
Parties)
(Down to Congress and the
Economy)
(Business Cycles and Political
Parties)
(Down to tables of data.)
There are many different economic indicators that one might apply to rank United States presidential administrations and congresses on how well they handled the economy. I have picked the following:
Therefore, I calculate a score (S) for presidential administrations since the Hoover administration using the following formula:
If C<0 (deflation) use: S=G-D+C-U; if C>0 (inflation) use:
S=G-D-C-U; i.e. S=G-D-|C|-U where |C|=absolute value of C.
This assumes that
high inflation (C>0) and high deflation (C<0) (depression) are equally
bad.
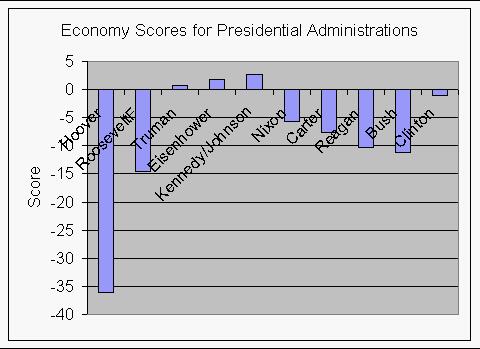
The scores for presidential administrations since 1929 are shown in the graph below and in the data table below the graph.
|
Presidents' Economy Scores. Note the unfortunate situation of Democratic President Carter's 4-year term being after an 8-year-term Republican administration and the fortunate situation of Republican Eisenhower being after a 20-year-term Democratic administration. Note that the Reagan/Bush administrations are almost as bad as the Franklin Roosevelt administration during World War II. Of course, the Roosevelt administration not only had to overcome the bad economy of the Hoover administration but, also, had to fight a major war. The Nixon administration started a major slide that the Carter administration could not overcome and the Reagan/Bush administrations continued the bad situation. The Clinton administration began the rise back to good economic times. |
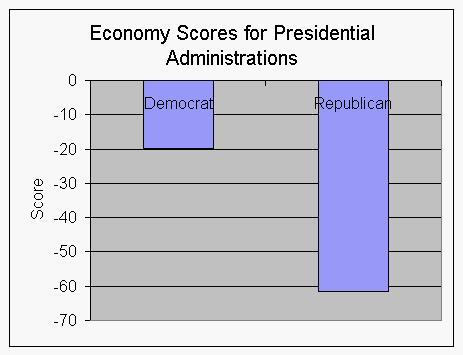 |
This compares the sum of the scores for the Democratic administrations (Roosevelt, Truman, Kennedy/Johnson, Carter, Clinton) and Republican administrations (Hoover, Eisenhower, Nixon, Reagan, Bush). Nuff said! |
| Graphs of the separate components of the economy score. | |
| Back to
top of Presidents' and Congresses' Economy Scores (Back to Politics) (Back to Economy and Political Parties) |
|
For Congresses it is not so easy to devise a score. Instead I calculate correlation coefficients over the years 1930-1999 for the various components of the score, the score, the ratio of Democrats to Republicans in the Senate, House and President (Democrat=1, Republican =0). I used Microsoft Excel to calculate the correlation coefficients. The help file for MS Excel describes how to interpret the correlations coefficients: "You can use the Correlation tool to determine whether two ranges of data move together — that is, whether large values of one set are associated with large values of the other (positive correlation), whether small values of one set are associated with large values of the other (negative correlation), or whether values in both sets are unrelated (correlation near zero). "
Another way to ascertain the effect of party composition of the Congress is to assign the following government party control index:
| A diagram showing the Democratic Party Control Index: | ||
| Democratic Control | Democratic Party Control Index | Republican Control |
| nothing | 0 | President, House & Senate |
| Senate | 1 | President & House |
| House | 2 | President & Senate |
| House & Senate | 3 | President |
| President | 4 | House & Senate |
| President & Senate | 5 | House |
| President & House | 6 | Senate |
| President, House & Senate | 7 | nothing |
The correlation coefficients are:
| Correlations | % GDP Change | % Debt Increase | ABS(% CPI Change) | % Unemployed Change | Score=G-D-C-U | Senate Dem/Rep | House Dem/Rep | President Dem/Rep | Democrat Control | Republican Control |
| % GDP Change | 1 | |||||||||
| % Debt Increase | 0.373 | 1 | ||||||||
| ABS(% CPI Change) | 0.097 | 0.165 | 1 | |||||||
| % Unemployed Change | -0.901 | -0.278 | 0.166 | 1 | ||||||
| Score=G-D-C-U | 0.293 | -0.741 | -0.362 | -0.407 | 1 | |||||
| Senate Dem/Rep | 0.16 | 0.07 | -0.22 | -0.28 | 0.11 | 1 | ||||
| House Dem/Rep | 0.16 | 0.05 | -0.09 | -0.21 | 0.09 | 0.77 | 1 | |||
| President Dem/Rep | 0.26 | 0.09 | -0.05 | -0.36 | 0.12 | 0.32 | 0.24 | 1 | ||
| Democrat Control | 0.41 | 0.18 | -0.09 | -0.48 | 0.15 | 0.49 | 0.45 | 0.88 | 1 | |
| Republican Control | -0.41 | -0.18 | 0.09 | 0.48 | -0.15 | -0.49 | -0.45 | -0.88 | -1 | 1 |
The five blue cells show the correlation coefficients for:
Thus, Democratic Congresses and presidents more often coincide with high economy scores than do Republican Congresses and presidents.
The yellow cells show the correlations of the four components of the economy score with Democratic Senates, Houses, presidents and Democratic/Republican control of the government. Notable is the sizeable negative correlation coefficients for unemployment and Democratic Senates/Houses/presidents and the sizeable positive correlation coefficients for GDP (gross domestic product) and Democratic Senates/Houses/presidents. Of particular note is the 0.41 correlation between Democratic control and the increase in GDP and the 0.48 correlation between Republican control and the increase in unemployment.
The purple cells show the correlation coefficients for having Democratic Senates, Houses and presidents; that is, how likely it is to have one with the other.
It is clear from the above that the U.S. economy is generally better during Democratic party control than it is during Republican party control. Some possible reasons why this is the case are:
Another measure of the goodness of the economy is the number of months in a business-cycle expansion and contraction. I have analyzed these in another web page.
The table below gives the values used to calculate the economy scores for presidential administrations since 1929.
| President | Average % GDP Change | Average % Debt Increase | Average ABS(% CPI change) | Average Change % Unemployed | Combined Averages (G-D-|C|-U) | Years |
| Hoover | -17.10 | 5.13 | 7.07 | 6.80 | -36.09 | 4* |
| RooseveltF | 11.25 | 23.91 | 3.52 | -1.67 | -14.51 | 13 |
| Truman | 7.16 | 0.06 | 6.16 | 0.16 | 0.79 | 7 |
| Eisenhower | 4.98 | 1.45 | 1.49 | 0.31 | 1.73 | 8 |
| Kennedy/Johnson | 7.10 | 2.67 | 2.05 | -0.25 | 2.63 | 8 |
| Nixon | 9.07 | 7.91 | 6.36 | 5.84 | -11.03 | 8 |
| Carter | 11.28 | 9.23 | 9.73 | 6.54 | -14.22 | 4 |
| Reagan | 7.86 | 13.78 | 4.65 | 7.54 | -18.11 | 12 |
| Bush | 5.47 | 11.80 | 4.35 | 6.30 | -16.99 | 4 |
| Clinton | 5.68 | 4.86 | 2.36 | 5.21 | -6.75 | 8 |
| Total | Total | Total | Total | Total | ||
| Democrat | 42.47 | 40.72 | 23.80 | 9.99 | -32.05 | |
| Republican | 10.28 | 40.07 | 9.78 | 26.79 | -66.36 | |
| * Data available only for the last 3 years. | ||||||
| For the CPI average the absolute value (|CPI|) is used; that is, inflation and deflation are considered equally bad. | ||||||
| For the combined averages CPI is taken as the absolute value for the same reason. | ||||||
| Graphs of the separate components of the economy score. | ||||||
| Back to
top of Presidents' and Congresses' Economy Scores (Back to Politics) (Back to Economy and Political Parties) |
||||||
| Economy Indicators and Political Party Control of Government | ||||||||||||
| Party Control variable: 7=PHS, 6=PH, 5=PS, 4=P, 3=HS, 2=H, 1=S, 0=none | ||||||||||||
| Year | % GDP Change | % Debt Increase | ABS(% CPI Change) | % Unemployed Change | Score= G-D-C-U |
Senate Dem/Rep | House Dem/Rep | President Dem/Rep | Democrat Control | Republican Control | Year | President |
| 1929 | -3.8 | 0 | 0.70 | 0.61 | 0 | 0 | 7 | 1929 | Hoover | |||
| 1930 | -11.96 | -4.4 | 2.3 | 5.50 | -15.35 | 0.98 | 0.61 | 0 | 0 | 7 | 1930 | Hoover |
| 1931 | -16.10 | 3.8 | 9 | 7.20 | -36.11 | 0.98 | 0.99 | 0 | 0 | 7 | 1931 | Hoover |
| 1932 | -23.24 | 16.0 | 9.9 | 7.70 | -56.82 | 1.64 | 0.99 | 0 | 1 | 6 | 1932 | Hoover |
| 1933 | -4.08 | 15.7 | 5.1 | 1.30 | -26.14 | 1.64 | 2.68 | 1 | 7 | 0 | 1933 | RooseveltF |
| 1934 | 17.02 | 20.0 | 3.1 | -3.20 | -2.91 | 2.76 | 2.68 | 1 | 7 | 0 | 1934 | RooseveltF |
| 1935 | 11.06 | 6.1 | 2.2 | -1.60 | 4.37 | 2.76 | 3.13 | 1 | 7 | 0 | 1935 | RooseveltF |
| 1936 | 14.19 | 17.7 | 1.5 | -3.20 | -1.80 | 4.41 | 3.13 | 1 | 7 | 0 | 1936 | RooseveltF |
| 1937 | 9.80 | 7.8 | 3.6 | -2.60 | 0.96 | 4.41 | 3.74 | 1 | 7 | 0 | 1937 | RooseveltF |
| 1938 | -6.31 | 2.0 | 2.1 | 4.70 | -15.14 | 3.00 | 3.74 | 1 | 7 | 0 | 1938 | RooseveltF |
| 1939 | 6.85 | 8.8 | 1.4 | -1.80 | -1.56 | 3.00 | 1.55 | 1 | 7 | 0 | 1939 | RooseveltF |
| 1940 | 10.11 | 6.3 | 0.7 | -2.60 | 5.76 | 2.36 | 1.55 | 1 | 7 | 0 | 1940 | RooseveltF |
| 1941 | 25.07 | 13.9 | 5 | -4.70 | 10.83 | 2.36 | 1.65 | 1 | 7 | 0 | 1941 | RooseveltF |
| 1942 | 27.70 | 47.9 | 10.9 | -5.20 | -25.91 | 1.50 | 1.65 | 1 | 7 | 0 | 1942 | RooseveltF |
| 1943 | 22.62 | 89.1 | 6.1 | -2.80 | -69.81 | 1.50 | 1.06 | 1 | 7 | 0 | 1943 | RooseveltF |
| 1944 | 10.74 | 46.8 | 1.7 | -0.70 | -37.01 | 1.50 | 1.06 | 1 | 7 | 0 | 1944 | RooseveltF |
| 1945 | 1.50 | 28.7 | 2.3 | 0.70 | -30.19 | 1.50 | 1.28 | 1 | 7 | 0 | 1945 | RooseveltF/Truman |
| 1946 | -0.31 | 4.2 | 8.3 | 2.00 | -14.77 | 0.88 | 1.28 | 1 | 6 | 1 | 1946 | Truman |
| 1947 | 9.94 | -4.1 | 14.4 | 0.00 | -0.33 | 0.88 | 0.76 | 1 | 4 | 3 | 1947 | Truman |
| 1948 | 10.31 | -2.3 | 8.1 | -0.15 | 4.68 | 1.29 | 0.76 | 1 | 5 | 2 | 1948 | Truman |
| 1949 | -0.70 | 0.2 | 1.2 | 2.30 | -4.39 | 1.29 | 1.54 | 1 | 7 | 0 | 1949 | Truman |
| 1950 | 9.94 | 1.8 | 1.3 | -0.84 | 7.66 | 1.02 | 1.54 | 1 | 7 | 0 | 1950 | Truman |
| 1951 | 15.36 | -0.8 | 7.9 | -1.93 | 10.21 | 1.02 | 1.18 | 1 | 7 | 0 | 1951 | Truman |
| 1952 | 5.63 | 1.5 | 1.9 | -0.26 | 2.46 | 0.96 | 1.18 | 1 | 6 | 1 | 1952 | Truman |
| 1953 | 5.94 | 2.7 | 0.8 | -0.10 | 2.55 | 0.96 | 0.96 | 0 | 0 | 7 | 1953 | Eisenhower |
| 1954 | 0.32 | 4.8 | 0.7 | 2.67 | -7.82 | 1.02 | 0.96 | 0 | 1 | 6 | 1954 | Eisenhower |
| 1955 | 8.95 | 0.7 | 0.4 | -1.23 | 9.05 | 1.02 | 1.14 | 0 | 3 | 4 | 1955 | Eisenhower |
| 1956 | 5.49 | -1.5 | 1.5 | -0.24 | 5.71 | 1.04 | 1.14 | 0 | 3 | 4 | 1956 | Eisenhower |
| 1957 | 5.37 | -0.6 | 3.3 | 0.18 | 2.52 | 1.04 | 1.16 | 0 | 3 | 4 | 1957 | Eisenhower |
| 1958 | 1.39 | 2.9 | 2.8 | 2.54 | -6.87 | 1.88 | 1.16 | 0 | 3 | 4 | 1958 | Eisenhower |
| 1959 | 8.44 | 2.8 | 0.7 | -1.39 | 6.29 | 1.88 | 1.85 | 0 | 3 | 4 | 1959 | Eisenhower |
| 1960 | 3.94 | -0.3 | 1.7 | 0.09 | 2.41 | 1.78 | 1.85 | 0 | 3 | 4 | 1960 | Eisenhower |
| 1961 | 3.47 | 2.1 | 1 | 1.15 | -0.73 | 1.78 | 1.50 | 1 | 7 | 0 | 1961 | Kennedy |
| 1962 | 7.48 | 2.5 | 1 | -1.13 | 5.14 | 2.03 | 1.50 | 1 | 7 | 0 | 1962 | Kennedy/Johnson |
| 1963 | 5.49 | 1.9 | 1.3 | 0.07 | 2.18 | 2.03 | 1.47 | 1 | 7 | 0 | 1963 | Johnson |
| 1964 | 7.39 | 2.8 | 1.3 | -0.48 | 3.79 | 2.13 | 1.47 | 1 | 7 | 0 | 1964 | Johnson |
| 1965 | 8.38 | 0.9 | 1.6 | -0.65 | 6.50 | 2.13 | 2.11 | 1 | 7 | 0 | 1965 | Johnson |
| 1966 | 9.61 | 2.6 | 2.9 | -0.72 | 4.80 | 1.78 | 2.11 | 1 | 7 | 0 | 1966 | Johnson |
| 1967 | 5.68 | 4.7 | 3.1 | 0.05 | -2.13 | 1.78 | 1.33 | 1 | 7 | 0 | 1967 | Johnson |
| 1968 | 9.28 | 3.9 | 4.2 | -0.28 | 1.48 | 1.38 | 1.33 | 1 | 7 | 0 | 1968 | Johnson |
| 1969 | 8.10 | 2.8 | 5.5 | -0.07 | -0.18 | 1.38 | 1.27 | 0 | 3 | 4 | 1969 | Nixon |
| 1970 | 5.52 | 5.7 | 5.7 | 1.49 | -7.36 | 1.23 | 1.27 | 0 | 3 | 4 | 1970 | Nixon |
| 1971 | 8.55 | 9.0 | 4.4 | 0.97 | -5.80 | 1.23 | 1.42 | 0 | 3 | 4 | 1971 | Nixon |
| 1972 | 9.91 | 5.9 | 3.2 | -0.35 | 1.12 | 1.33 | 1.42 | 0 | 3 | 4 | 1972 | Nixon |
| 1973 | 11.70 | 4.6 | 6.2 | -0.74 | 1.63 | 1.33 | 1.26 | 0 | 3 | 4 | 1973 | Nixon |
| 1974 | 8.34 | 4.8 | 11 | 0.78 | -8.27 | 1.65 | 1.26 | 0 | 3 | 4 | 1974 | Nixon |
| 1975 | 8.94 | 17.0 | 9.1 | 2.83 | -20.04 | 1.65 | 2.02 | 0 | 3 | 4 | 1975 | Nixon |
| 1976 | 11.54 | 13.3 | 5.8 | -0.77 | -6.82 | 1.61 | 2.02 | 0 | 3 | 4 | 1976 | Nixon |
| 1977 | 11.38 | 10.0 | 6.5 | -0.65 | -4.48 | 1.61 | 2.04 | 1 | 7 | 0 | 1977 | Carter |
| 1978 | 13.02 | 9.8 | 7.6 | -0.98 | -3.37 | 1.41 | 2.04 | 1 | 7 | 0 | 1978 | Carter |
| 1979 | 11.78 | 7.1 | 11.3 | -0.22 | -6.39 | 1.41 | 1.75 | 1 | 7 | 0 | 1979 | Carter |
| 1980 | 8.93 | 10.1 | 13.5 | 1.33 | -15.96 | 0.87 | 1.75 | 1 | 6 | 1 | 1980 | Carter |
| 1981 | 12.01 | 10.6 | 10.3 | 0.44 | -9.32 | 0.87 | 1.26 | 0 | 2 | 5 | 1981 | Reagan |
| 1982 | 4.08 | 16.4 | 6.2 | 2.09 | -20.57 | 0.85 | 1.26 | 0 | 2 | 5 | 1982 | Reagan |
| 1983 | 8.46 | 17.8 | 3.2 | -0.11 | -12.48 | 0.85 | 1.62 | 0 | 2 | 5 | 1983 | Reagan |
| 1984 | 11.25 | 17.9 | 4.3 | -2.09 | -8.84 | 0.89 | 1.62 | 0 | 2 | 5 | 1984 | Reagan |
| 1985 | 7.13 | 17.0 | 3.6 | -0.32 | -13.17 | 0.89 | 1.39 | 0 | 2 | 5 | 1985 | Reagan |
| 1986 | 5.69 | 9.2 | 1.9 | -0.19 | -5.23 | 1.22 | 1.39 | 0 | 3 | 4 | 1986 | Reagan |
| 1987 | 6.50 | 10.6 | 3.6 | -0.83 | -6.86 | 1.22 | 1.46 | 0 | 3 | 4 | 1987 | Reagan |
| 1988 | 7.71 | 10.7 | 4.1 | -0.68 | -6.43 | 1.22 | 1.46 | 0 | 3 | 4 | 1988 | Reagan |
| 1989 | 7.45 | 9.8 | 4.8 | -0.23 | -6.91 | 1.22 | 1.49 | 0 | 3 | 4 | 1989 | Bush |
| 1990 | 5.72 | 13.2 | 5.4 | 0.36 | -13.19 | 1.27 | 1.49 | 0 | 3 | 4 | 1990 | Bush |
| 1991 | 3.15 | 13.4 | 4.2 | 1.23 | -15.64 | 1.27 | 1.60 | 0 | 3 | 4 | 1991 | Bush |
| 1992 | 5.56 | 10.9 | 3 | 0.64 | -8.98 | 1.33 | 1.60 | 0 | 3 | 4 | 1992 | Bush |
| 1993 | 5.12 | 8.5 | 3 | -0.58 | -5.83 | 1.33 | 1.47 | 1 | 7 | 0 | 1993 | Clinton |
| 1994 | 6.20 | 6.4 | 2.6 | -0.81 | -1.96 | 0.92 | 1.47 | 1 | 6 | 1 | 1994 | Clinton |
| 1995 | 4.91 | 6.0 | 2.8 | -0.51 | -3.38 | 0.92 | 0.89 | 1 | 4 | 3 | 1995 | Clinton |
| 1996 | 5.58 | 5.0 | 3 | -0.18 | -2.28 | 0.87 | 0.89 | 1 | 4 | 3 | 1996 | Clinton |
| 1997 | 6.47 | 3.6 | 2.3 | -0.48 | 1.04 | 0.87 | 0.92 | 1 | 4 | 3 | 1997 | Clinton |
| 1998 | 5.67 | 2.1 | 0.6 | -0.43 | 3.42 | 0.87 | 0.92 | 1 | 4 | 3 | 1998 | Clinton |
| 1999 | 5.79 | 2.4 | 2.2 | -0.28 | 1.51 | 0.87 | 0.95 | 1 | 4 | 3 | 1999 | Clinton |
| 2000 | -0.22 | 0.87 | 0.95 | 1 | 4 | 3 | 2000 | Clinton | ||||
| Year | % GDP Change | % Debt Increase | ABS(% CPI Change) | % Unemployed Change | Score= G-D-C-U |
Senate Dem/Rep | House Dem/Rep | President Dem/Rep | Democrat Control | Republican Control | Year | President |
| Back
to top of Presidents' and Congresses' Economy Scores (Back to Politics) (Back to Economy and Political Parties) |
||||||||||||