L. David Roper
http://www.roperld.com/personal/RoperLDavid.htm
2 July, 2016
Many news stories imply that there is a resurgent in crude-oil extraction in the United States. E.g., see Oil Industry Booms – in North Dakota. I use the Energy Information Agency extraction and reserves data for crude oil for the six states (TX, ND, OK, UT, CO, NM) that have been having a rise in extraction to show that the “resurgence” is minor compared to the decline that has been underway since 1975.
The depletion curve that I use to fit the data is the Verhulst function:
![]() is the amount to be eventually extracted,
is the amount to be eventually extracted, ![]() is the rising exponential time constant in years units, n
is the rising exponential time constant in years units, n![]() is the falling exponential time constant and t1/2 is the time in years units at which the resource is one-half depleted. The parameter n determines the amount of skewing at large times. For n = 1 the extraction curve is symmetrical and the peak occurs at t1/2. The deviation of the peak time from t1/2 is negative for n > 1 (skewed toward large times) and is positive for n < 1 (skewed toward small times).
is the falling exponential time constant and t1/2 is the time in years units at which the resource is one-half depleted. The parameter n determines the amount of skewing at large times. For n = 1 the extraction curve is symmetrical and the peak occurs at t1/2. The deviation of the peak time from t1/2 is negative for n > 1 (skewed toward large times) and is positive for n < 1 (skewed toward small times).
The maximum of P(t) occurs at ![]() , which yields
, which yields ![]() . Note that, for the symmetric case (n=1):
. Note that, for the symmetric case (n=1): ![]() and
and ![]() .
.
Note the summation over N Verhulst functions since often more than one Verhulst function is needed for a good fit to extraction data for minerals.
Recent EIA data for the states of the U.S. show that there has been a rise in crude-oil production in six
states: TX, ND, OK, UT, CO, NM. The data are yearly extraction rates (units of 109 barrels/year) from
1981 to 2012 (2012 estimated after September) and estimated reserves in 2010. Using the Verhulst function to fit the extraction rates
constrained by the estimated reserves, the following results are obtained.
The EIA estimate for crude-oil reserves in North Dakota has been rising over the last few years. When a reserves estimate is rising with time, the eventual peak is the value that should be used in fitting the extraction rate. When the reserves estimate is falling, the last-available estimate is the value that should be used in fitting the extraction rate. (The latter is the case for crude-oil extraction in the U.S.).
Here is a fit of the Verhulst function to crude-oil reserves estimates for North Dakota assuming that the fall is the same as the rise:
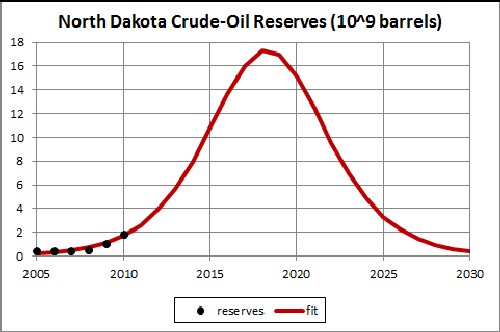
The peak of the fit is 14.87 x 10⁹ barrels. This reserves value is used to calculate the projected extraction rate for crude oil in North Dakota assuming that the decline is at the same rate as the rise:
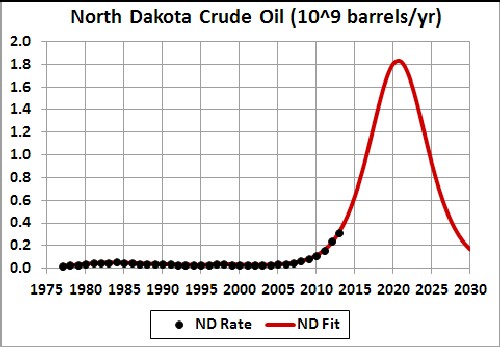
If the estimated reserves is correct, t he extraction will peak before 2020 and then fall rapidly.
http://www.fcnp.com/commentary/national/11418-the-peak-oil-crisis-parsing-the-bakken-.html
Here is a fit of the Verhulst function to crude-oil reserves estimates for Texas assuming that the fall is the same as the rise:
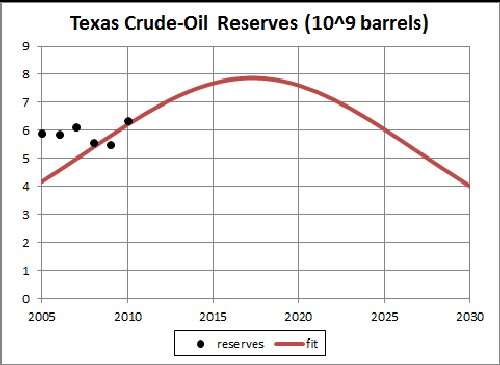
Only the three most recent values were used in the fit. They are really insufficient for a fit, but are all that are available.
The peak of the fit is 7.856 x 10⁹ barrels. This reserves value is used to calculate the projected extraction rate for crude oil in North Dakota assuming that the decline is at the same rate as the rise:
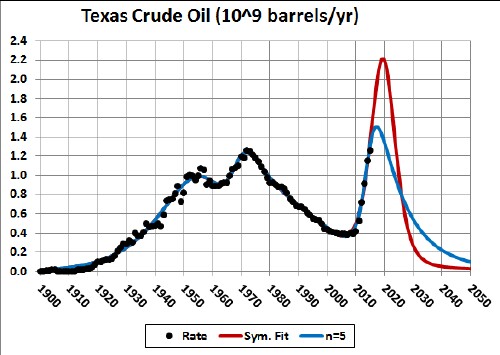
Early Texas data are from the Railroad Commission of Texas.
Here is a fit of the Verhulst function to crude-oil reserves estimates for Oklahoma assuming that the fall is the same as the rise:
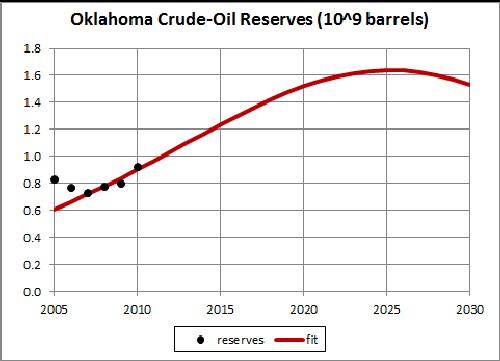
Only the four most recent values were used in the fit. They are really insufficient for a fit, but are all that are available.
The peak of the fit is 1.639 x 10⁹ barrels. This reserves value is used to calculate the projected extraction rate for crude oil in North Dakota assuming that the decline is at the same rate as the rise:
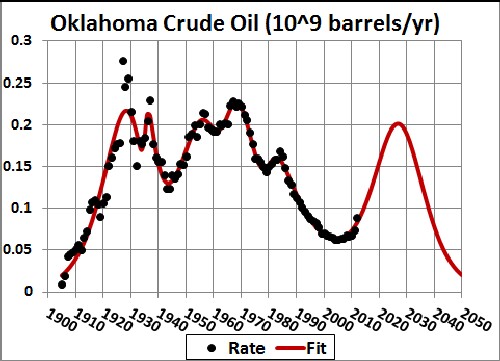
Early Oklahoma data are from http://www.ogs.ou.edu/oilgasfaq.php .
If the estimated reserves is correct, the extraction will peak before 2015 and then fall rapidly.
Here is a fit of the Verhulst function to crude-oil reserves estimates for Utah assuming that the fall is the same as the rise:
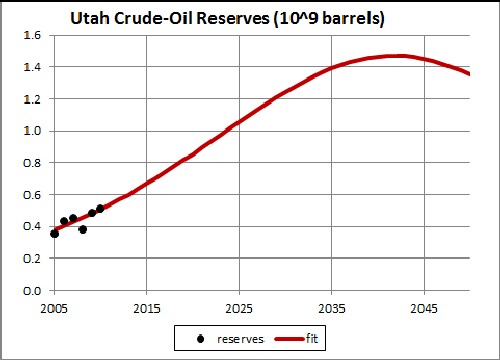
The reserves estimates versus time are really insufficient for a fit, but are all that are available.
The peak of the fit is 1.470 x 10⁹ barrels. This reserves value is used to calculate the projected extraction rate for crude oil in North Dakota assuming that the decline is at the same rate as the rise:
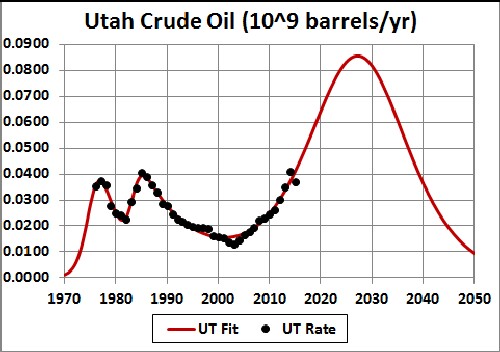
If the reserves estimate is correct, the extraction will peak before 2025 and then fall rapidly.
Here is a fit of the Verhulst function to crude-oil reserves estimates for Colorado assuming that the fall is the same as the rise:
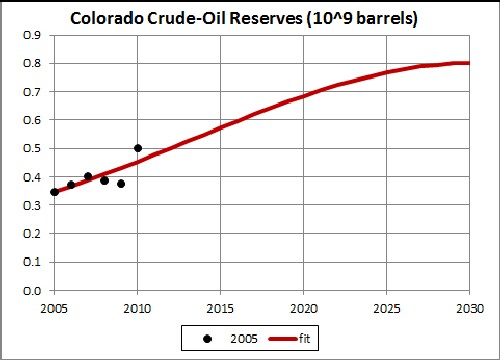
The reserves estimates versus time are really insufficient for a fit, but are all that are available.
The peak of the fit is 0.802 x 10⁹ barrels. This reserves value is used to calculate the projected extraction rate for crude oil in North Dakota assuming that the decline is at the same rate as the rise:
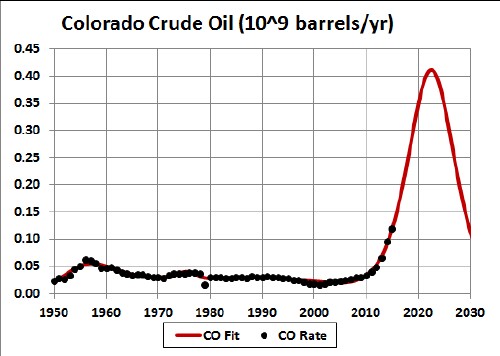
If the reserves estimate is correct, the extraction will peak before 2020 and then fall rapidly.
Here is a fit of the Verhulst function to crude-oil reserves estimates for New Mexico assuming that the fall is the same as the rise:
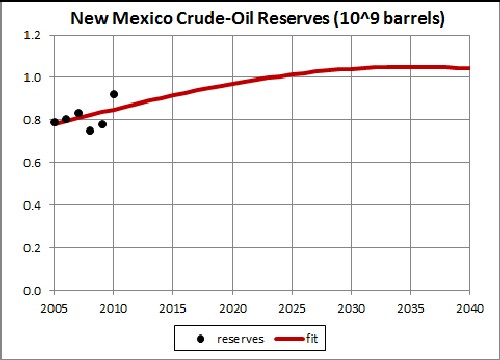
The reserves estimates versus time are really insufficient for a fit, but are all that are available.
The peak of the fit is 1.051 x 10⁹ barrels. This reserves value is used to calculate the projected extraction rate for crude oil in North Dakota assuming that the decline is at the same rate as the rise:
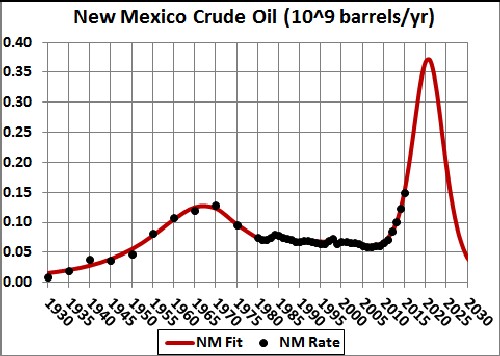
If the reserves estimate is correct, the extraction will peak before 2015 and then fall rapidly.
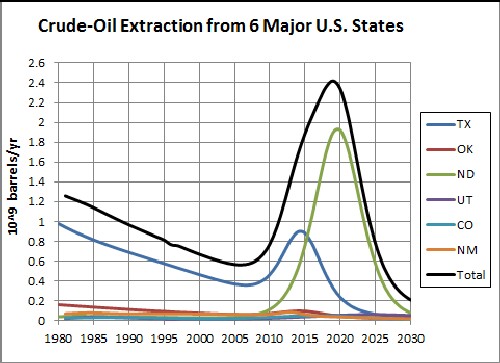
Plotting all six states together:
Comparing to total U.S. crude-oil extraction:
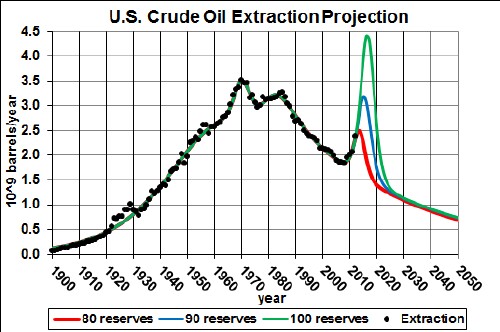
The red curve is for the 2010 EIA reserves estimate (23.3x10⁹ barrels). Reserves values are rough estimates, so are not expected to be accurate. The blue curve is for tripling the reserves to 75 x109 barrels.
The recent rise in extraction will probably peak before 2020 and then decline rapidly.
Obviously, there is no hope for long-term crude-oil independence for the United States.
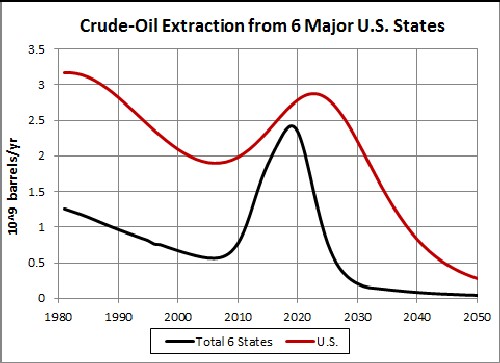
The following graph compares the crude-oil extraction projection for the six states and the U.S.:
Comparing to total World crude-oil extraction:
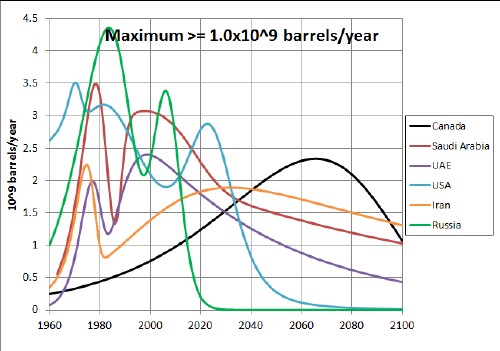
This compares crude-oil extraction for the six largest countries.
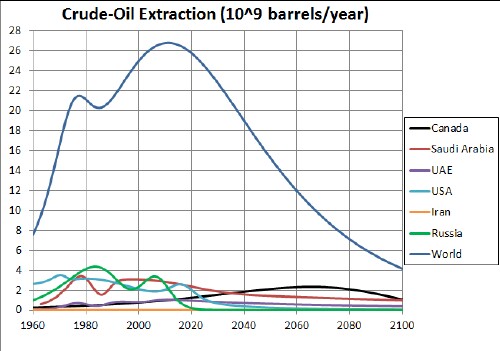
The "resurgence" in crude-oil extraction in the United States may be large compared to the overall U.S. extraction curve and to other major extraction countries, but will not be large compared to the total world extraction curve. World-crude-oil extraction is the major determinant of the price of crude-oil.
One often hears or reads that North America will be independent of world crude-oil for the long-term future. Here is a comparison of North-American (Canada, Mexico and United States) extraction to world extraction:
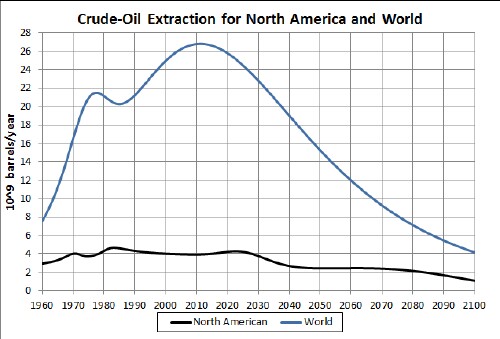
If the current reserves estimates for Canada and the United States are correct, the combined late extraction peaks of those two countries do give a sizeable bump as the world extraction is declining. But, by 2100 all countries have declined to nearly negligible extraction values. Hopefully, the few remaining decades of extraction will be used to develop infrastructure for renewable energy and for making useful items instead of burning the crude oil and thereby creating more dangerous global warming.
A better estimate of the crude-oil reserves for the United States is needed to reliably project crude-oil extraction into the future.