L. David Roper
http://www.roperld.com/personal/roperldavid.htm
5 April, 2016
In James Hansen's book, Storms of My Grandchildren: The Truth About the Coming Climate Catastrophe and Our Last Chance to Save Humanity, a graph (Figure 20) shows how the Arctic and Antarctic summer sea ice area has changed from 1979 to 2009. (A more detailed graph is in http://nsidc.org/seaice/characteristics/difference.html . Satellite data are available from 2002.) The amount of summer sea ice at Antarctica appears to be fairly stable or increasing slightly, but the summer Arctic sea ice area is decreasing rapidly.
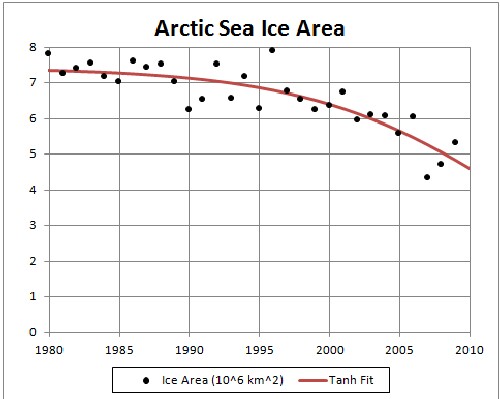
In this work I fit the hyperbolic tangent function to the summer-Arctic-sea-ice data and project the fit into the future. The result is that the Arctic sea ice will be gone by 2050.
The equation for the fit is ![]() , which is shown in the following graph:
, which is shown in the following graph:
 |
It was allowed that the asymptote could be greater than zero, but it searched to zero. |
No account has been allow here for the fact that atmospheric carbon will decrease after fossil-fuels extraction peaks at about 2025.
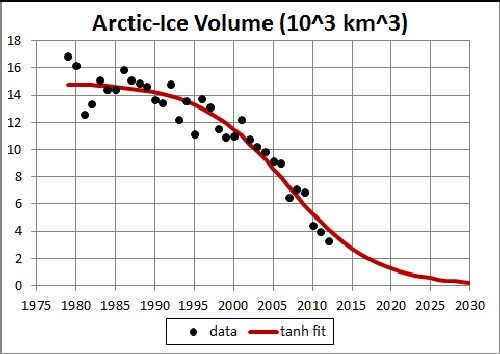
A graph of the data is in http://a-m-e-g.blogspot.com. Fitting a hyperbolic tangent to the data yields:

These data indicate that Arctic ice will be gone by ~2030.
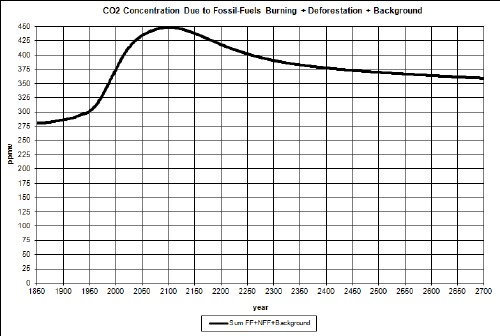
In another study I have projected atmospheric-carbon-dioxide concentration (CD) into the future; one a least-case (LC) projection and another a worst-case (WC) projection. For LC the CD peaks at about 470 ppmv at about year 2115; for WC the CD peaks at about 1110 ppmv at about year 2135. The peaks are due to the fact that fossil-fuels extraction have extraction peaks due to depletion of the resources.
Here are graphs of the two cases:
 |
 |
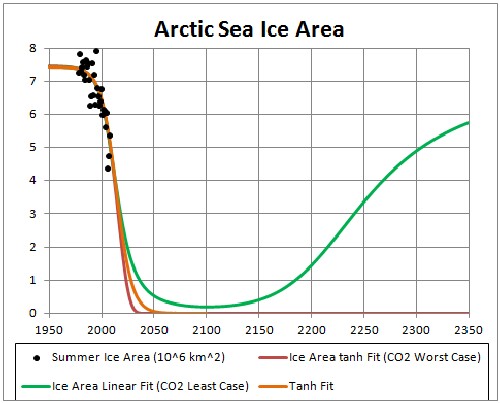
Here I report on fits of the Arctic-sea-ice area to the two CD cases using the hyperbolic-tangent function
![]() ,
,
where CD = atmospheric-carbon-dioxide concentration.
The reason for using the hyperbolic tanget is because the ice are must asymptotically approach some value greater than or equal to zero.
The three fits are shown in the following graph:

Both CD fits eventually rise after going toward or near zero, because the fossil-fuels extraction (and, thus, use) falls to zero after peaking. The LC one rises faster because its carbon-dioxide concentration is lower.
Both CD fits eventually rise after going to or near zero, because the fossil-fuels extraction (and, thus, use) falls to zero after peaking. The LC one rises faster because its carbon-dioxide concentration is lower.
The data trend for Arctic summer sea ice is for it to disappear by 2050. More data are needed in the future to make this date more certain.
For hyperbolic-tangent fits to atmospheric-carbon-dioxide concentration (CD), it eventually recovers, especially for the least-case CD.
Global Ice Mass Loss
L. David Roper interdisciplinary studies