 .
.Global warming deniers often take the stability or slight increase of summer Antarctic sea ice area as "proof" that global warming is not occurring. However, recent research has shown that the ozone hole in the southern hemisphere is responsible for summer Antarctica sea ice not decreasing due to global warming.
In James Hansen's book, Storms of My Grandchildren: The Truth About the Coming Climate Catastrophe and Our Last Chance to Save Humanity, a graph (Figure 20) shows how the Arctic summer sea ice and Antarctic summer sea ice area has changed from 1979 to 2009. (A more detailed graph is in http://nsidc.org/seaice/characteristics/difference.html; see also http://earthobservatory.nasa.gov/Features/WorldOfChange/sea_ice_south.php for data.)
Ozone Hole in Southern Hemisphere
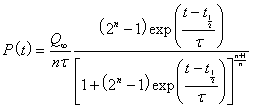
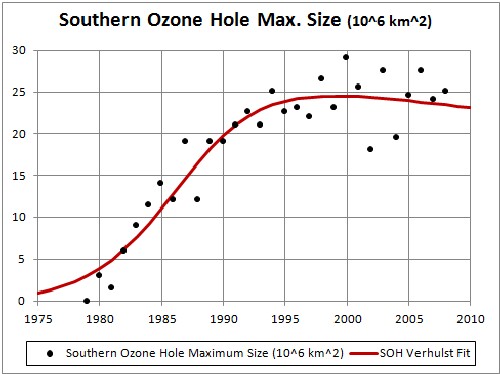
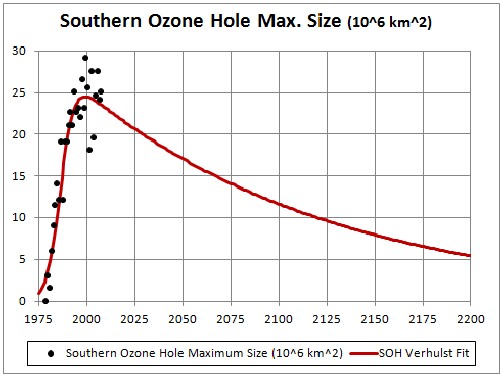
I used data for the peak ozone-hole area for the southern hemisphere to account for the fact that Antarctic summer sea ice has not been decreasing due to global warming. To do this I first fitted the peak ozone-hole area as a Verhulst function of time in years:
 .
.
The peak usually occurred in late September.
The fit is shown in the following graph:
 |
 |
In this work I fit the hyperbolic;tangent function to the summer-Antarctic-sea-ice data as a function of atmospheric-carbon-dioxide concentration plus a linear function of southern-ozone-hole size and project the fit into the future. The result is that the Antarctic sea ice will be gone by 2025.
The equation for the fit is
![]() ,
,
where CD = atmospheric-carbon-dioxide concentration (ppmv) and SOH = Summer Ozone Hole size.
The reason for using the hyperbolic tanget is because the ice area must asymptotically approach some value greater than or equal to zero.
The fit is shown in the following graph:
|
The rapid drop is due to the pent up atmospheric-carbon-dioxide concentration. Thus, the trend is that all summer Antarctic sea ice will be gone by 2025. It is similar to the drop in summer-Arctic-sea-ice area. The least-case fit rises to about 3x10⁶ km2 in year 2600 due to the carbon-dioxide-concentration decline. |
See the Artic sea ice web page for the definitions of CO2 Least Case and CO2 Worst Case.
The trend for Antarctic summer sea ice is for it to disappear by 2025. Many more data are needed in the future to make this date more certain.
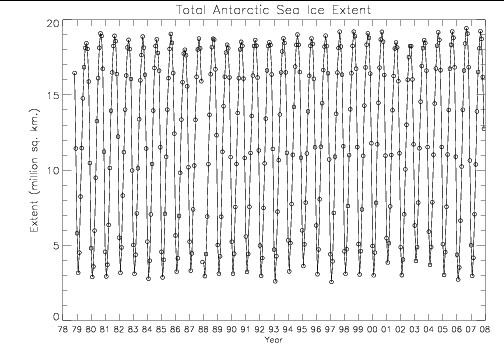
The Antarctic-sea-ice-area data used in this work are:
| September–February | September Average Extent (106 km2) |
February Average Extent (106 km2) |
1979–2000 mean |
18.7 |
2.9 |
1999–2000 |
19.0 |
2.8 |
2000–2001 |
19.1 |
3.7 |
2001–2002 |
18.4 |
2.9 |
2002–2003 |
18.2 |
3.8 |
2003–2004 |
18.6 |
3.6 |
2004–2005 |
19.1 |
2.9 |
2005–2006 |
19.1 |
2.6 |
2006–2007 |
19.4 |
2.9 |
2007–2008 |
19.2 |
3.7 |
2008–2009 |
18.5 |
2.9 |
An example of the data used for the ozone-hole area is shown in the following graph:
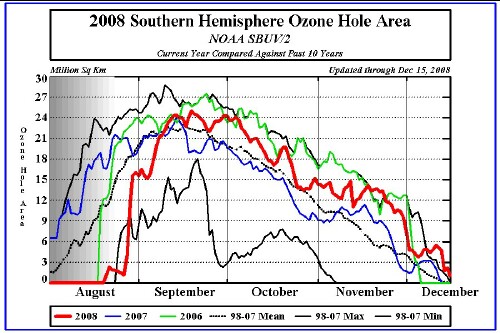
Peak data taken from this graph are:
2006 |
27.5x10⁶ km2 |
2007 |
24x106 km2 |
2008 |
25x106 km2 |
It is interesting that the peak ozone-hole area (~25x106 km2) is larger than the winter-sea-ice area (~19x106 km2) and much larger than the summer-sea-ice area (~3x10⁶ km2).
Global Ice Mass Loss
Roper Global-Heating Web Pages
L. David Roper interdisciplinary studies