L. David Roper
http://www.roperld.com/personal/RoperLDavid.htm
2 July, 2016
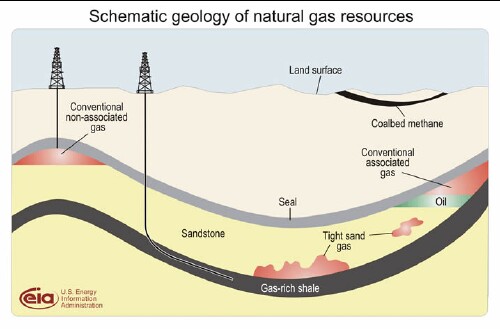
Shale gas is natural gas extracted from shale deposits in the earth. Here is a diagram that shows how it is extracted:

Shale has low permeability to natural gas, so natural gas extraction from shale requires fracturing the shale deposits. Hydraulic fracturing is used to create the fracturing. There are environmental degradation issues with hydraulic fracturing. A documentary film, Gasland, has been made about the dangers of hydraulic fracturing to extract natural gas. Another documentary, Shale Gas and America's Future, gives great detail about the drilling and fracking process and discusses the environmental problems.
The locations in the United States that contain shale-gas are shown here:
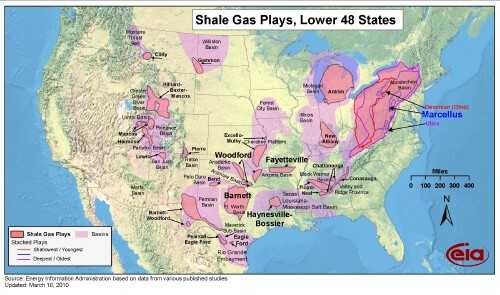
In 2008, the main areas of extraction were Texas (1433x109 ft3), Arkansas (279x109 ft3), Oklahoma (151x109 ft3) and Michigan (118x109 ft3). United States shale-gas extraction data are available only for 2007 (1184x109 ft3) and 2008 (2022x109 ft3) from the Energy Information Agency; however, I found data elsewhere for 2000-2008.
Shale-gas recoverable reserves have been estimated at 264 x1012 ft3 = 264 Tcf.
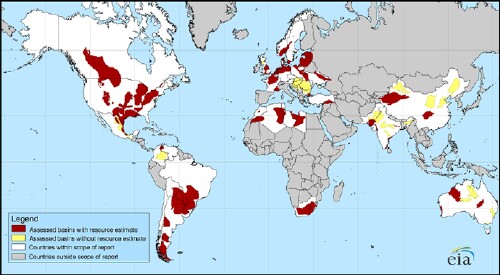
The locations of shale gas for the world are shown here:
These data prompted me to look into the depletion of United States shale gas. Using the extraction (not “production”, resources are “extracted” not “produced”) data for 2007-2014, the estimated recoverable reserves (318 x1012 ft3) and the generalized Verhulst function, which allows time asymmetry, to fit the meager data, I get the following symmetric depletion curve:
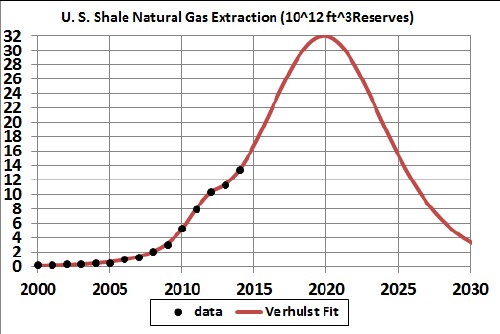
Two Verhulst functions were used for the fit and the reserves used is 336 x 1012 ft3, larger than the 2013 reserves.
There are some who say that the 2013 reserves for shale gas in the U.S. is higher than 318 x 1012 ft3. Assume that it is as high as 500 x 1012 ft3; then the symmetric depletion fit is:
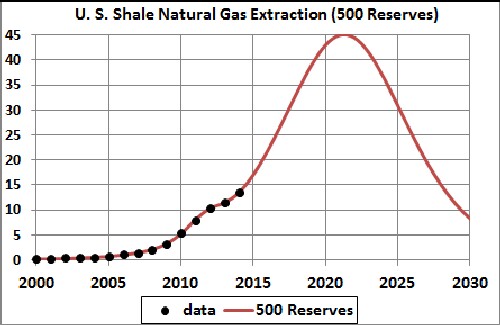
Note that the peak is about 40% bigger than for 336 Tcf but occurs only 2 years later.
In both cases shell gas will only be available for about 2 decades.
However, see
J. David Hughes (Drilling Deeper) has done a micro-analysis of the all US shale-gas plays:
So the asymmetry parameter, n, for shale-gas extraction in the U.S.can be estimated from the combined seven largest shale-gas plays projected extraction as determined by Hughes:
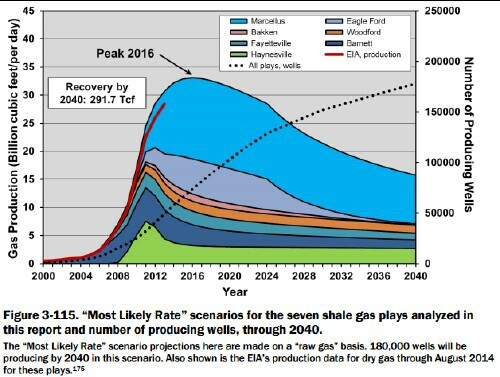
“Most Likely Rate” scenario of combined seven largest shale-gas plays extraction.
Hughes' curve is asymmetric; i.e., n > 1.
I fitted a Verhulst function to the Hughes combined seven largest shale-gas plays curve to get the asymmetric parameter n:
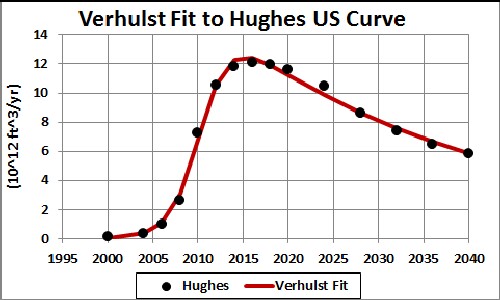
The asymmetric parameter, n, is 18. (The Y-axis has been changed from 10^9 ft^3/day to 10^12 ft^3/yr.)
Then a Verhulst fit was done to the U.S. crude oil extraction data with the asymmetric parameter fixed at 18 for the future shale-gas peak::
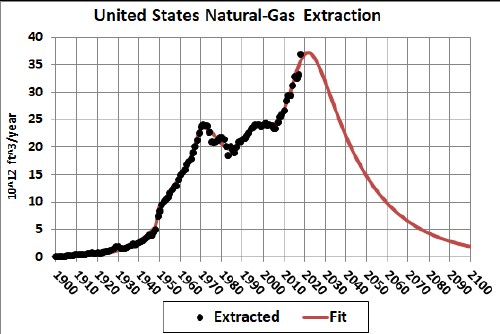
All Verhulst parameters were varied except the n parameter for the future peak, which was set at 18. The calculated 2013 reserves for this curve is 1759 x 109 barrels , much above the estimated reserves value (1350 x 109 barrels) given above.
The extraction is projected to peak several years before 2025 and then fall rapidly in future years.
Adding the 500-Tcf-reserves shale gas to the conventional natural-gas depletion curve for the United States yields:
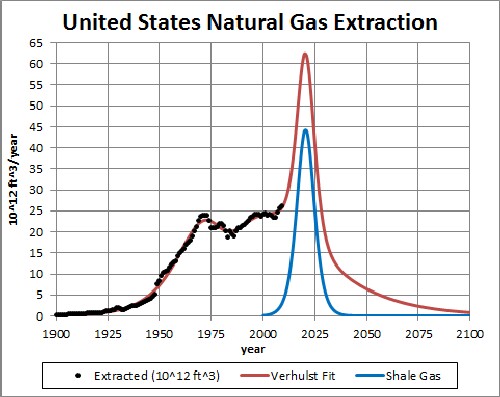
This seems highly unlikely!
So, shale natural gas adds a short large blip to the natural-gas extraction for the United States. It could be reduced in size and stretched out over a larger time interval, but I doubt it will be. The U.S. will probably extract and use it as fast as possible.
I could not find any data for shale-gas extraction for the world. Since the U.S. is way ahead of other nations in this effort, I assume that the extraction-rate data for the world is essentially the same as for the U.S.
I also assume that the extractable reserves for the U.S. is 500 Tcf and that the extracable reserves for the world is the ratio of the Earth land area to the U.S. land area (~16) times 500 Tcf = ~8000 Tcf. Then the symmetric depletion fit for world shale gas is:
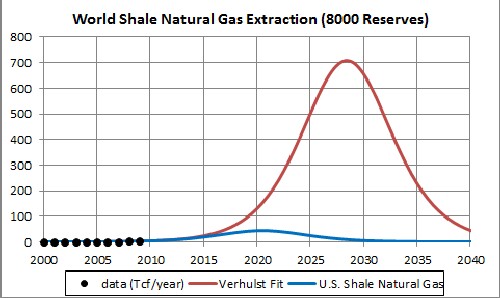
Adding the 8000-Tcf-reserves shale gas to the conventional natural-gas depletion curve for the World yields:
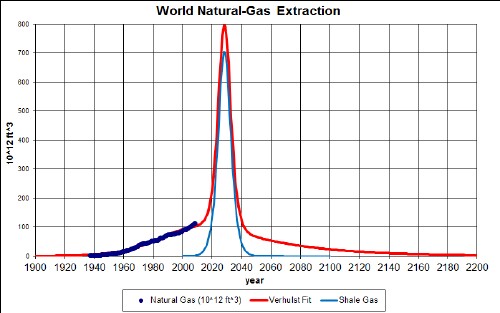
So, shale natural gas adds a short large blip to the natural-gas extraction for the World. It could be reduced in size and stretched out over a larger time interval, but I doubt it will be. The world will probably extract and use it as fast as possible.
See the following web pages:
Trade-secret chemicals are inserted into the shale formations to fractionate ("fracking") the formation into cracks for the gas to seep through to the well pipe. There is strong indications that the fracking allows the gas to seep up into the water table, contamination wells for human use. There is very little information about what the chemicals used might be doing to the environment.
A documentary film, Gasland, has been made about the dangers of hydraulic fracturing to extract natural gas. Another documentary, Shale Gas and America's Future, gives great detail about the drilling and fracking process and discusses the environmental problems. The TV program 60 minutes showed a program about fracking.
There is an effort in the Congress to regulate the gas companies such that they have to disclose the chemicals used in fracking.
Studies calculate that greenhouse emissions (methane) are 40% to 50% greater for shale natural gas than conventional natural gas.
Politicians and citizens need information such as these curves, net energy and carbon dioxide emitted, both by the extraction process and the burning of the gas, to make informed decisions about whether to allow environmentally-destructive processes such as extraction of natural gas from shale deposits.
I hope that the shale-gas bonanza will be used largely to create infrastructure for renewable energies instead of for frivolous purposes. See http://www.roperld.com/science/SolarFuture.htm .
For a detailed study of the "duration" of shale-gas extraction in the United States see: http://www.roperld.com/science/minerals/shalegasextractiondurationUS.pdf .