L. David Roper
http://www.roperld.com/personal/RoperLDavid.htm
2 July, 2016
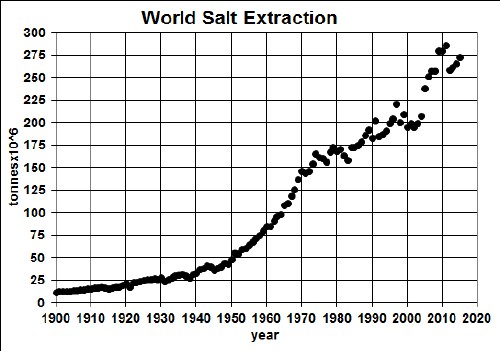
Of course, salt (sodium Chloride, NaCl) is very important for existence of life. it being an important solute in bodily fuids. It is also important for food preservation and spicing. It is used for many industrial processes, in fire extinguishers and for de-icing roadways.
| Rank | Country/Region | 2012 salt extraction (metric tonnes) |
% of world production |
|---|---|---|---|
— |
World |
259,000,000 |
100 % |
1 |
70,000,000 |
27.03 % | |
— |
other countries |
43,500,000 |
16.8 % |
2 |
37,200,000 |
14.36 % | |
3 |
17,000,000 |
6.56 % | |
4 |
11,900,000 |
4.59 % | |
5 |
10,800,000 |
4.17 % | |
5 |
10,800,000 |
4.17 % | |
5 |
10,800,000 |
4.17 % | |
6 |
8,060,000 |
3.11 % | |
7 |
7,020,000 |
2.71 % | |
8 |
6,700,000 |
2.59 % | |
9 |
6,100,000 |
2.36 % | |
10 |
5,900,000 |
2.28 % | |
11 |
5,000,000 |
1.93 % | |
12 |
4,390,000 |
1.69 % | |
13 |
3,810,000 |
1.47 % |

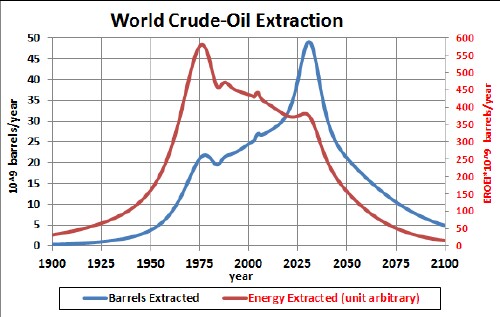
Assume that the main source of energy for salt extration is made from crude oil since the early 1900s. The amount of energy available from crude oil as a function of time is proportional to the red curve in this graph::

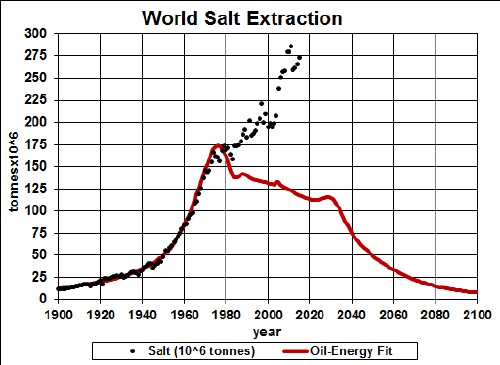
Fitting the salt-extraction data to the crude-oil energy with a linear function yields the red curve in this graph:

The fit is only to date up to year 1985.
Obviously, some other function is needed to explain the extraction data after 1985.
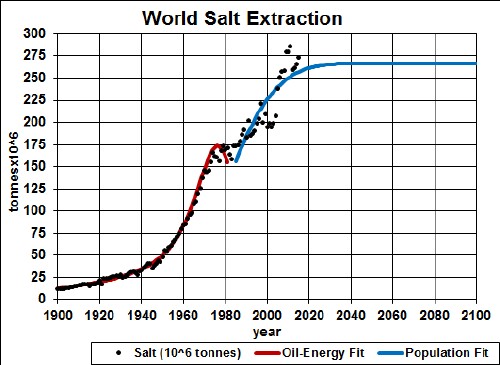
Assume that the more recent data after 1985 is mainly due to world population increase, shown in this graph:

Fitting the salt-extraction data after year 1985 to world populatioln with a linear function yields the blue curve in this graph:

Perhaps the blue curve is a reasonable projection of future world salt extraction.