Gold extraction rate for the world and two Verhulst functions fits to the data.
L. David Roper
http://www.roperld.com/personal/RoperLDavid.htm
2 July, 2016
Gold has been used for making currency coins for many millennia. In the minds of many people it is still the basis for an international monetary standard. Since about 1980 is has been used extensively in electronics manufacturing, because it is the most ductile and malleable of all metals and is a good conductor of electricity and heat
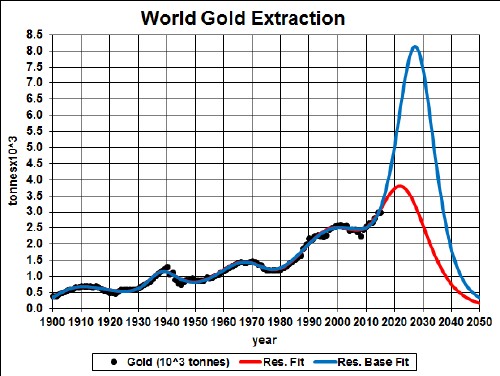
The graph below shows the gold extraction data for the world and Verhulst function fits to the data for two different amounts of eventual extraction in order to extrapolate into the future.
Gold extraction rate for the world and two Verhulst functions fits to the data.
The red curve is obtained by restricting the total extraction (225x103 tonnes) to the amount already extracted (about 144x103 tonnes) plus the estimated reserves of about 54x103 tonnes; the blue curve is obtained by restricting the total extraction (300x103 tonnes) to the amount already extracted (about 144x103 tonnes) plus the estimated reserves base of about 100x103 tonnes.
It appears that average world-gold extraction will peak somewhere between 2020 and 2030.
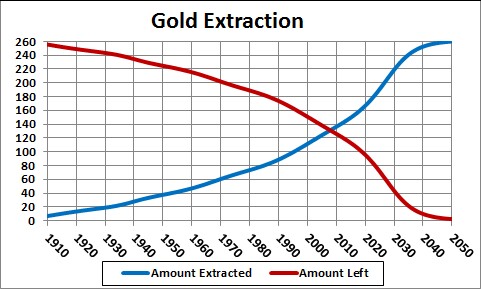
Taking an average extraction curve of the two fits, the crossover point at year ~2008 when the amount extracted is equal to the amount left to be extracted is shown here:
Undoubtedly there is much recycling of gold, especially since many people and nations hold gold as a "currency". By the term "recycle" I refer to gold that is resold for storage as well as to be used to make items.
Assume that:
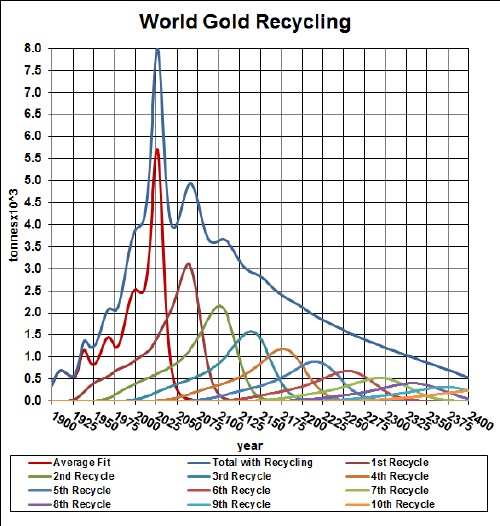
The effective gold available for purchase after the first ten recycling cycles is shown in the following graph, along with the effective gold available for each cycle for the average of the two extraction cases described above:
The equation for a recycling cycle is
 ,
,
where Ei is the amount available from the previous cycle. Here is an example of the Excel coding:
{=(($J$2+$I$2)/2+(($J$2-$I$2)/2)*TANH((A27-$K$2)/$L$2))*SUM($I$27:I27*(EXP(-1*((A27-$A$27:A27-$N$2)/$O$2)^2/2))/$O$2/SQRT(2*PI()))} (The curly bracket surrounding the term makes it into an array; it must be entered by holding down the SHIFT & CTRL keys while pressing the ENTER key.)
Of course, the recycling could be extended to more cycles, skewing the curve further into the future. However, the peak and fall off after it will not change because further cycles are essentially zero in that time region.
Thus, under the assumptions given above, the effective amount of gold available for making items peaks before 2025 and falls off rapidly after that. Humans will have taken concentrated gold deposits and scattered them across the surface of the earth.
The Excel spreadsheet is set up to make it easy to calculate with different recycling assumptions.
Here is another study of world gold extraction.
Dividing the gold recycling curve above by the projected world population (asymptote ~1010), one gets:
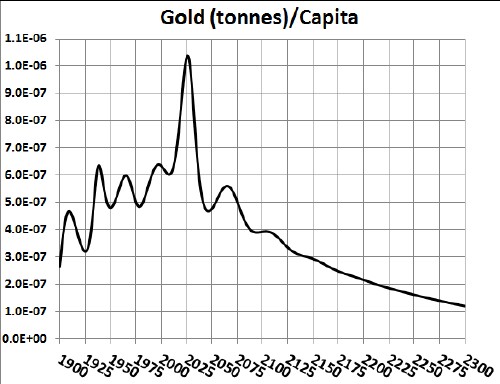
Although the recycling peak is at ~2030, the per-capita peak is at ~2025. This makes gold not a good choice for a future world representative currency.
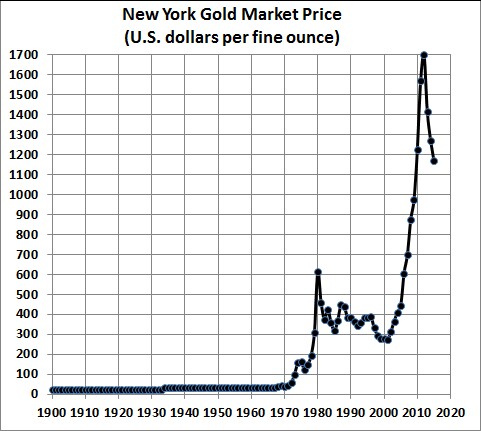
Gold prices are very volatile due to its perceived value as an unofficial currency; when official currents and stock markets are in trouble, gold often effectively replaces them:
To predict future gold prices, assume that they are proportional to the negative of some power of the amount left to be extracted. For the two extraction cases described above, the results are:
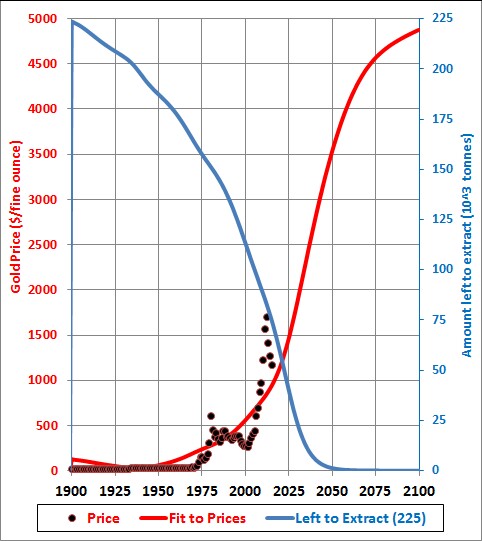
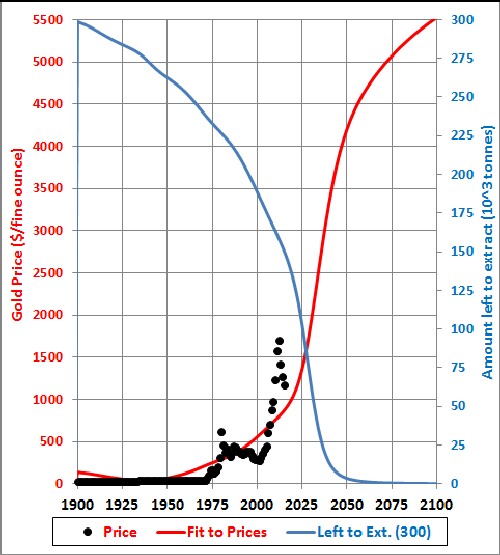
So, the prediction is that gold will sell for between $5000 and $5500 per fine ounce at ~2100.