L. David Roper
http://www.roperld.com/personal/RoperLDavid.htm
9 August, 2016
World Fossil Fuels Depletion
The U.S. state of Texas is having a boom in extracting natural gas by the technique of fractionating ("fracking") shale/dolomite formations. A "boom" in nonrenewable resource extraction from the Earth is defined as a time period in which extraction is occurring very fast in a given area; thus, many workers come in from outside the area to man the drilling rigs, to build housing for the oil workers and to provide other services for the increased population.
This article shows mathematically that the Texas natural-gas boom will become a bust within a decade. A "bust" in nonrenewable resource extraction from the Earth is defined to begin at the time when extraction of the resource peaks and then falls to negligible amounts over a time period.
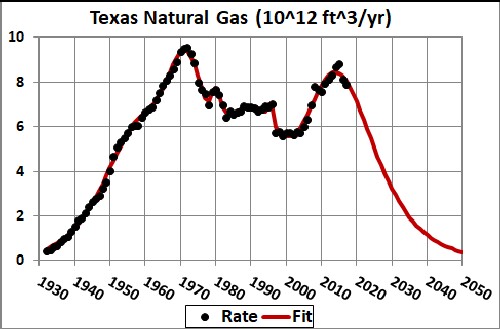
The U.S. Energy Information Administration gives monthly and annual natural-gas extraction data for Texas since 1981.
Those data are fitted by a depletion function, the Verhulst function, in this study to determine when the extraction will peak.
The data and the fits to the data are given in a later section.
A reliable estimate of reserves is needed to fit extraction data by a function for projecting into the future for a nonrenewable resource Here is a good definition of reserves of a nonrenewable resource.
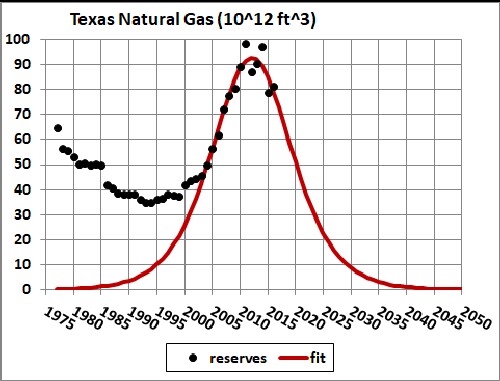
The U.S. Energy Information Administration gives reserves estimates from 1977 to 2011 for natural-gas extraction in Texas, which are shown here by black dots for years 2004 to 2011:
The curve is a fit to the 8 data using the Verhulst function described in the next section, assuming that the curve will be symmetrical. Since the reserves estimates have been rising each year since 2004, the fit is done to get a rough estimate of the peak value of the reserves estimate in the future, which is ~125.5 x 1012 ft3.
The depletion function that is used in this article is the Verhulst function:
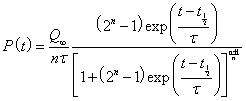
The asymmetry parameter, n, must be greater than 0.
where 
The maximum of P(t) occurs at ![]() , which yields the peak value
, which yields the peak value ![]() .
.
For the symmetric case (n=1): ![]() and
and ![]() .
.
For a depletion situation for which there are N peaks the depletion function is:
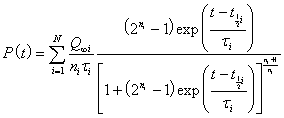 .
.
When a peak is symmetrical, the Verhulst function simplifies to
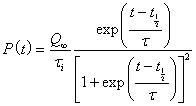 .
.
The depletion curve for natural-gas extraction for Texas has essentially three peaks; so N=3 in the depletion equation. The fit to the extraction data using the reserves peak, ~125.5 x 1012 ft3, given in a previous section is:
The final large peak is assumed to be symmetric. Asymmetry would shift the peak backward for n > 1 (depletion curve skewed forward with a smaller peak) and forward for n < 1 (depletion curve skewed backward with a larger peak).
The area under the curve is equal to the amount already extracted (~485 x 1012 ft3) plus the reserves value (~115 x 1012 ft3).
If this high reserves value (~115 x 1012 ft3) is correct, the final peak occurs about now! The onset of the bust could be extended out to later years by imposing environmental regulations and/or taxes on the extraction of natural gas, thereby reducing the extraction rate.
After getting the extraction curve above it occurred to the author that it would be interesting to see how the final peak value varies with the reserves amount. The following extraction curves were obtained for 7 different reserves values:
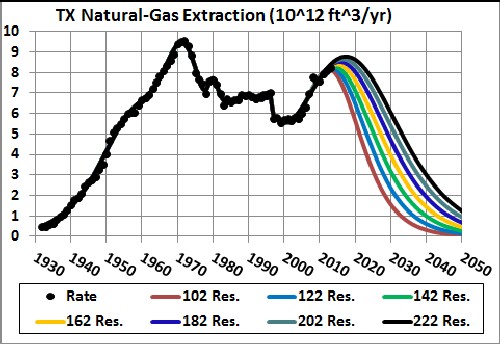
The area under each curve is equal to the amount already extracted (~468 x 1012 ft3) plus the reserves value.
The positions of the final peaks for 9 different reserves values are:
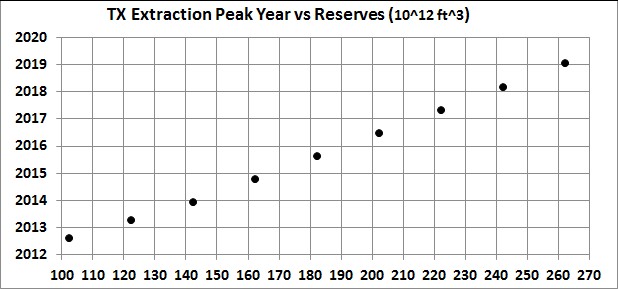
This has a logarithmic behavior as expected mathematically. That is, the rise in the peak year increases much less than linearly with the rise in reserves.
Even for an extremely high reserves value of 262 x 1012 ft3, the final peak position is ~2020 years, only 7 years from now! The reason the peaks occur so soon is because the extraction is occurring at a high rate. The rising exponential rates for the final peaks for 9 reserves values are:
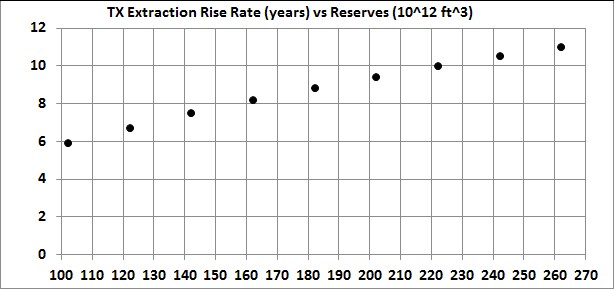
The rise rate is ~1.5 years. This is a high rise rate!
It is interesting to plot the chi square for the fit, which is a measure of the goodness of the function's fit to the extraction data, versus 9 reserves values::
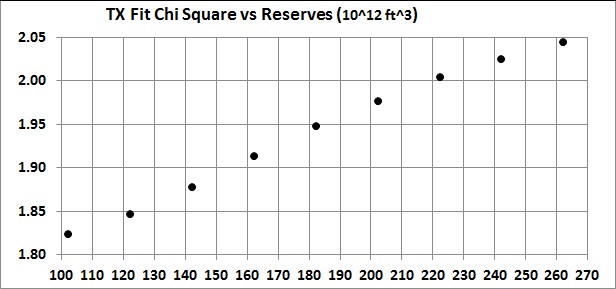
The lower the chi square the better the fit.
Even for very high estimates of natural-gas reserves for its extraction in Texas, the current boom will turn into a bust in less than a decade.
It would be wise for Texas to use the current natural-gas boom to build the policies and infrastructure for collecting energy from wind and solar, for encouraging drivers to drive electric vehicles and for fast charging stations for electric vehicles in personal and parking garages. Wind energy in Texas has a good start already.
It would be wise for the govenment of Texas to do some decade-long planning about how to best manage the coming natural-gas-extraction bust. A tax on natural-gas extraction to put in a fund to help manage the bust and to clean up the mess made by the extraction would be wise. Such tax might have an added benefit of slowing down the extraction so that the bust will not occur so soon, giving more time to prepare for it.
L. David Roper interdisciplinary studies
World Fossil Fuels Depletion
L. David Roper, http://arts.bev.net/RoperLDavid/
9 August, 2016