L. David Roper roperld@vt.edu
http://www.roperld.com/personal/RoperLDavid.htm
3 July, 2016
This document uses graphs to explain the history of crude oil and natural gas in the United States.
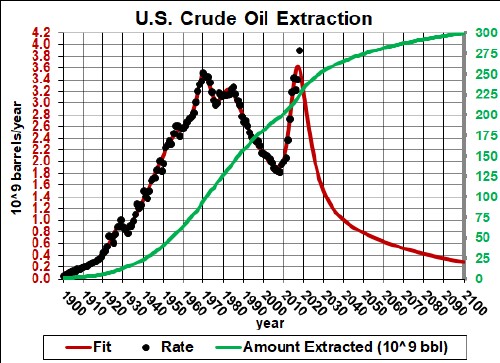
This graph shows the history of extraction of crude oil (black points) in the U.S.:

Note that it peaked in 1970 and then declined at about the same rate as it had grown before 1970. Then the "fracking loophole" or "Haliburton loophole" was enacted that allowed fracking for tight oil and shale gas with minimal federal regulations; this lead to the rapid rise of crude-oil extraction by fracking for tight oil.
Many studies agree with the red curve that shows the projected future extraction of crude oil in the U.S., using data for reserves. It will peak ~2016 and then decline rapidly.
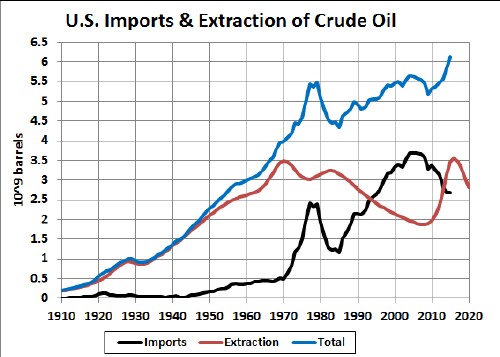
This graph shows the history of importation of crude oil into the U.S. (black curve), the extraction of crude oil (red curve) and the total of the two (blue curve):
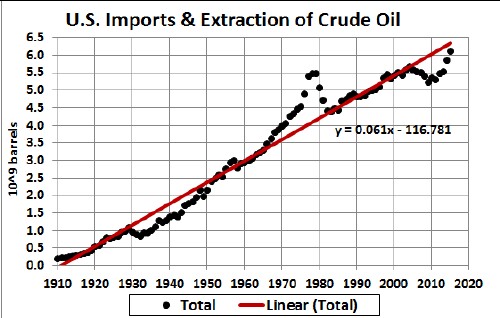
This graph shows the total with a linear fit versus year for it:
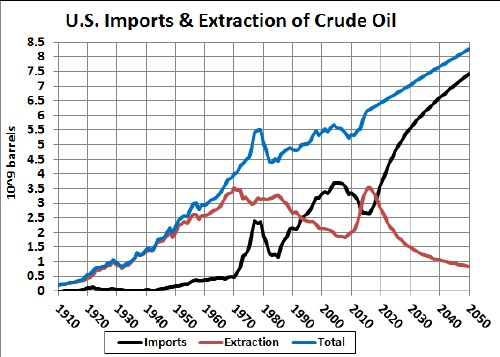
Assuming that the linear rise in total U.S. crude oil continues to 2050, the imports will follow the black curve in this graph:
U.S. exports of crude oil have been negligible:
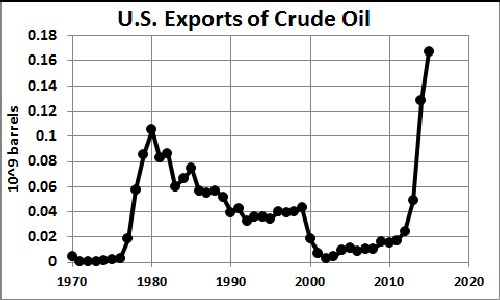
Exports will soon drop as extraction peaks and then falls rapidly.
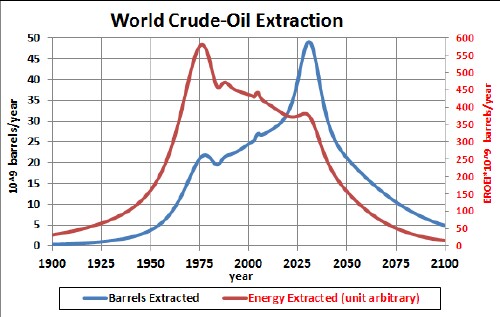
The energy/barrel required to extract crude oil has declined from an ERoEI of 100 to about 4 for fracking for tight oil. This graph shows how the actual energy obtained from crude oil in the U.S. has been steadily declining since 1976:
This shows how crude oil is used in the U.S.:
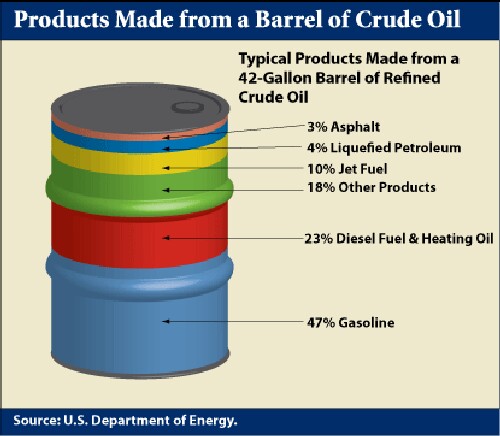
So, converting from using gasoline in automobiles to using electricity as fuel will be necessary very soon. This graph shows that the U.S. is on the way to doing that:
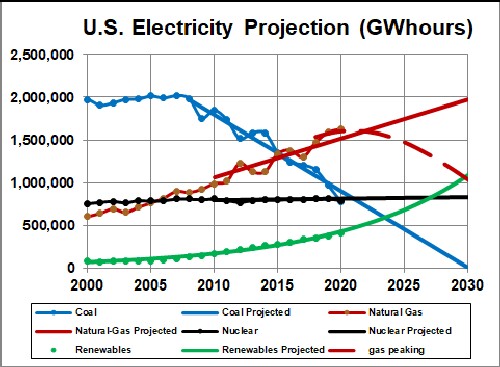
The green curve for renewables assumes that the current exponential trend will continue. The red curve for natural gas will not continue on the straight line toward 2030, but will bend downward since natural-gas extraction will decline rapidly, as shown below.
The following document is an attempt to project when all cars in the world will use electricity (both BEVs and PHEVs):
http://www.roperld.com/science/ElectricCarsTotal.htm
This graph shows the history of extraction of natural gas (black points) in the U.S.:
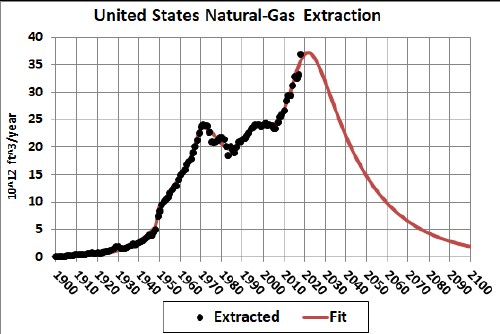
The "fracking loophole" or "Haliburton loophole" was enacted that allowed fracking for tight oil and shale gas gas with minimal federal regulations; this lead to the rapid rise of natural-gas extraction by fracking for shale gas.
Many studies agree with the red curve that shows the projected future extraction of natural gas in the U.S., using data for reserves. It will peak ~2017 and then decline rapidly.
This graph shows the history of imports and exports of natural gas in the U.S.:
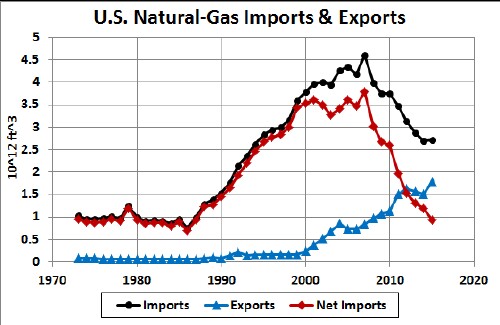
The red curve show the net imports.
This graph shows that the net imports of natural gas are negligible compared to the extraction:
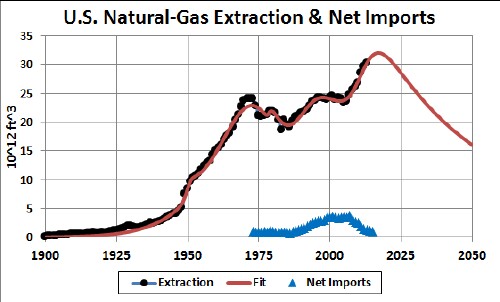
Imports of natural gas will probably increase as extraction peaks and declines rapidly.
This shows how natural gas is used in the U.S.:
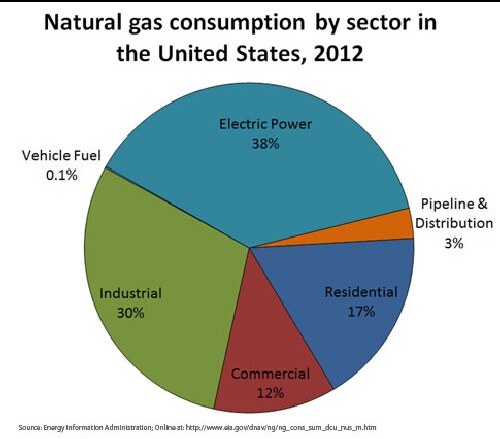
So, converting from using natural gas to produce electricity will be necessary very soon.
This graph shows that the U.S. is on the way to do that:

The red curve for natural gas will not continue on the straight line toward 2030, but will bend downward since natural-gas extraction will decline rapidly.