L. David Roper
http://www.roperld.com/personal/RoperLDavid.htm
11 May, 2019
One often reads in the press and/or on the Internet that a certain fossil fuel is sufficiently available to last hundreds of years. That is a meaningless statement because it implies, if not explicitly stated, the assumption that the current rate of extraction will remain the same into the future, which will not be even close to reality.
Any mineral, such as a fossil fuel, follows a depletion curve in its extraction rate in that it rises quickly and then slows down to a peak and they falls rapidly either faster or slower than it rose. That is, the peaked depletion curve may be asymmetric. The area under the depletion curve is the amount that will eventually be extracted, which is the sum of the amount already extracted plus the true extractable reserves. See an excellent mathematical method to arrive at a depletion curve for any mineral. The basic equation is the Verhulst function:
![]() is the amount to be eventually extracted,
is the amount to be eventually extracted, ![]() is the rising exponential time constant in years units, n
is the rising exponential time constant in years units, n![]() is the falling exponential time constant and t1/2 is the time in years units at which the resource is one-half depleted. The parameter n determines the amount of skewing at large times. For n = 1 the extraction curve is symmetrical and the peak occurs at t1/2. The deviation of the peak time from t1/2 is negative for n > 1 (skewed toward large times) and is positive for n < 1 (skewed toward small times). The maximum of P(t) occurs at
is the falling exponential time constant and t1/2 is the time in years units at which the resource is one-half depleted. The parameter n determines the amount of skewing at large times. For n = 1 the extraction curve is symmetrical and the peak occurs at t1/2. The deviation of the peak time from t1/2 is negative for n > 1 (skewed toward large times) and is positive for n < 1 (skewed toward small times). The maximum of P(t) occurs at ![]() , which yields
, which yields ![]() - Note that, for the symmetric case (n=1):
- Note that, for the symmetric case (n=1): ![]() and
and ![]() .
.
The sum is due to the fact that the extraction rate may have more than one peak.
Any study of fossil fuel extraction that claims to predict the future of the extraction, to be honest, must present the predicted depletion curve, not some meaningless statement about the future extraction. Then any study that refutes that prediction must show a depletion curve that disagrees with the one being refuted. The area under the refuting depletion curve must be equal to the sum of the amount already extracted plus a defensible estimate of the reserves. The best estimates of reserves for fossil fuels is given and regularly updated by the Energy Information Agency (EIA) of the United States Department of Energy. If the area under a depletion curve greatly deviates from the EIA value, a rational explanation must be given why. Here is an example of how the reserves value is used to determine the future shape of a depletion curve:
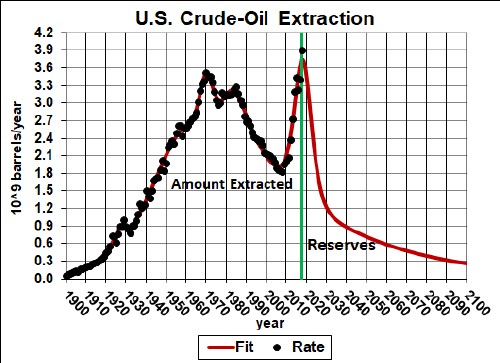
In this case of crude-oil extraction for the United States, the area labeled "Reserves" is larger than the EIA stated reserves, which is required to fit the measured extraction data. Reserves' values are rough estimates, so are not expected to be accurate.
In this article depletion curves for coal, crude oil and natural gas will be presented for the United States and the world using the Verhulst function to fit the extraction data using the EIA reserves' values. If anyone disagrees with these predictions of future extraction of fossil fuels, they should present competing depletion curves and rationally explain why the reserves' values differ from the EIA values.
Yearly Coal extraction data are given by EIA. Using these numbers one gets the following coal depletion curve for coal extraction in the United States:
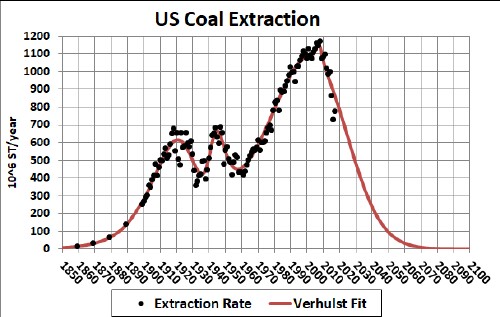
Note that three Verhulst functions are used to fit the extraction-rate data. It is possible that more peaks will occur as the average extraction rate falls.
The conclusion is that coal extraction in the United States is peaking and will fall off rapidly in the future, which is good news for reducing global warming.
World coal extraction-rate data and reserves are given by EIA. Using these numbers one gets the following coal depletion curve for extraction for the world:
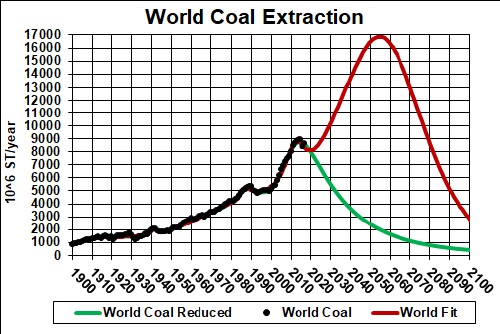
Note that several Verhulst functions are used to fit the extraction-rate data. It is possible that more peaks will occur as the average extraction rate falls.
Probably the shape of the future curve will not be as smooth as shown here, but the average extraction over years may peak soon and then fall off rapidly. It could peak later and higher and fall off more rapidly. As time progresses the reserves value may change either up or down. This does not bode well for reducing global warming.
Yearly crude-oil extraction data are given by EIA. Using these numbers one gets the following depletion curves for crude-oil extraction in the United States:
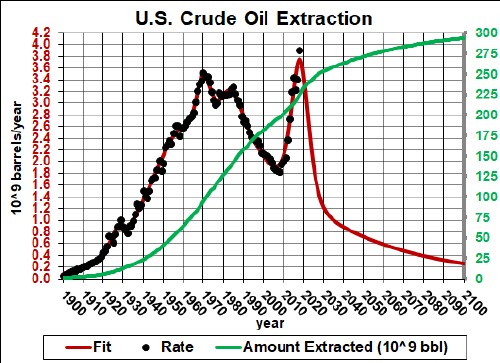
The green curve is the cumulative amount extracted up to given years.
Obviously, there is no hope for long-term crude-oil independence for the United States.
World crude-oil extraction-rate data and reserves are given by EIA. Using these numbers one gets the following depletion curve for crude-oil extraction for the world:
The green curve could be the case if nations decide that coal must be left in the Earth to mitigate global warming.
Note that two Verhulst functions are used to fit the extraction-rate data. It is possible that more peaks will occur as the average extraction rate falls.
For more details see http://www.roperld.com/science/minerals/FossilFuelsExtraction.pdf and http://www.roperld.com/science/minerals/FossilFuels.htm#WorldOil.
United States natural-gas extraction-rate data and reserves are given by EIA. Using these numbers one gets the following depletion curve for natural-gas extraction in the United States:
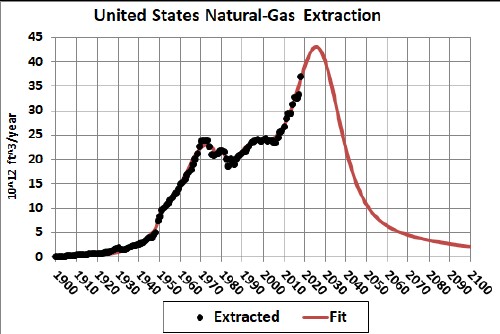
Note that several Verhulst functions are used to fit the extraction-rate data. It is possible that more peaks will occur as the average extraction rate falls.
For more details see:
World natural-gas extraction-rate data and reserves are given by EIA. Using these numbers one gets the following depletion curve for natural-gas extraction for the world:
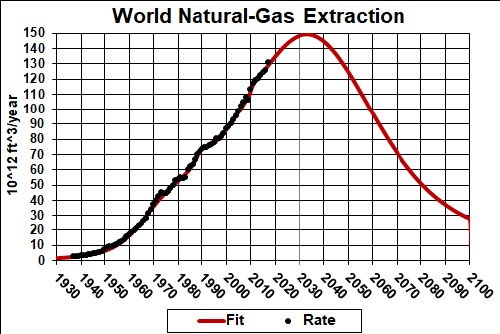
Note that several Verhulst functions are used to accurately fit the extraction-rate data.
The result of this study are:
All who disagree with these conclusions need to present their depletion curves and give rational explanations why the areas under the curves correspond to larger values for the reserves compared to the Energy Information Agency reserves' values.
Our descendants will reprimand us for burning valuable fossil hydrocarbons instead of using them to make useful objects and then recycling the material many times over to make more useful objects; especially since burning fossil fuels causes disastrous global warming.