 .
.L. David Roper
http://www.roperld.com/personal/roperldavid.htm
4 April, 2016
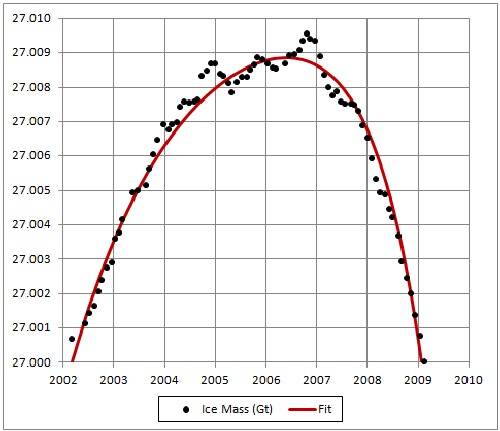
Antarctic-ice-mass-loss data are conveniently display in a graph. The data are ice-mass balance: accumulation minus ablation (includes melting) minus iceberg calving. I started with 27x106 gigatonnes of ice in 2009 and worked backward in time subtracting off the values taken from Figure 2 to get an approximate value for the Greenland ice mass for each data point.
In this work I fitted a hyperbolic tangent functions to the Greenland-ice-mass-loss data and projected the fits into the future.
If the Antarctica ice sheet were to all melt, sea level would rise by about 60 meters or 200 feet.
Units: 1 gigatonne = 1.1 km3 of ice. Ice mass of Antarctica = 27x106 gigatonnes = 30x106 km3.
The equation for the fit involving three hyperbolic tangents is
.
One of the fits is shown in the following graph:
All fits shown below fit the data about equally well. |
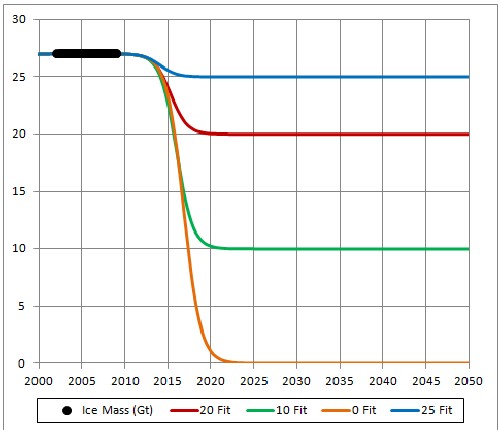
This shows five fits about equally probable, including one for which all Greenland ice melts before year 2025, which is slightly the best fit. The shape of the curve for years before now is of no concern except to fit the rising data from 2002 to 2007. It would be nice to have data before 2002 to include in the fit. |
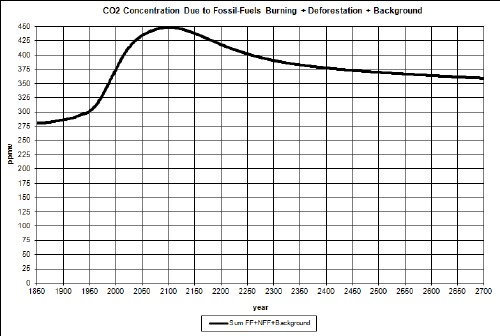
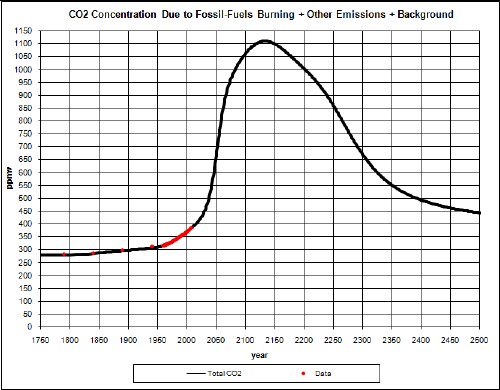
In another study I have projected atmospheric-carbon-dioxide concentration (CD) into the future; one a least-case (LC) projection and another a worst-case (WC) projection. For LC the CD peaks at about 470 ppmv at about year 2115; for WC the CD peaks at about 1110 ppmv at about year 2135. The peaks are due to the fact that fossil-fuels extraction have extraction peaks due to depletion of the resources.
Here are graphs of CD for the two cases:
 |
 |
Here I report on fits of the Antarctic-ice-loss area to the two CD cases using two different hyperbolic-tangent functions
 ,
, .
.where CD = atmospheric-carbon-dioxide concentration. That is, the rise is parametrized as an unknown cause and the fall is parametrized as due to CD.
The reason for using the hyperbolic tanget is because the ice are must asymptotically approach some value greater than or equal to zero.
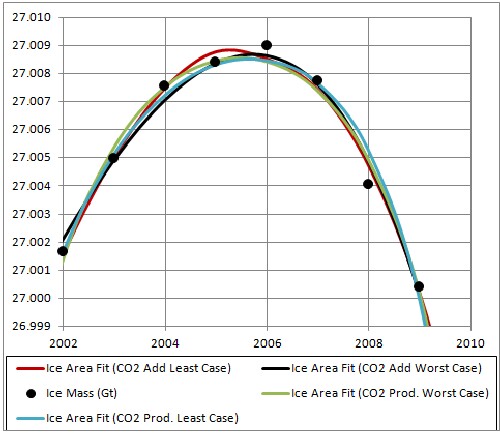
The four fits are shown in the following graphs:
 |
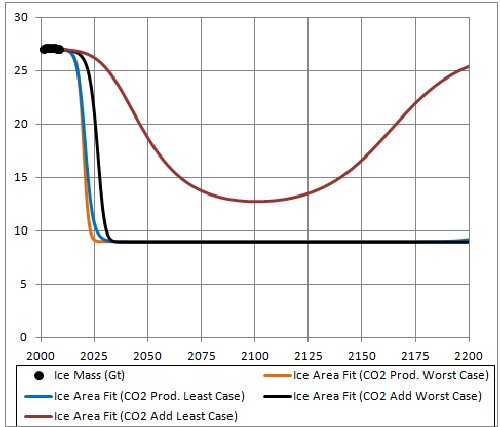 |
All CD fits eventually rise after going toward or near zero, because the fossil-fuels extraction (and, thus, use) falls to zero after peaking. The least-case one rises faster because its carbon-dioxide concentration is lower.
The recent rapid drop in Antarctic ice mass must be measured for many more years before one can use the hyperbolic tangent functions to project a future asymptote.
Global Ice Mass Loss
Roper Global-Heating Web Pages
L. David Roper interdisciplinary studies