L. David Roper
http://www.roperld.com/personal/roperldavid.htm
6 April, 2016
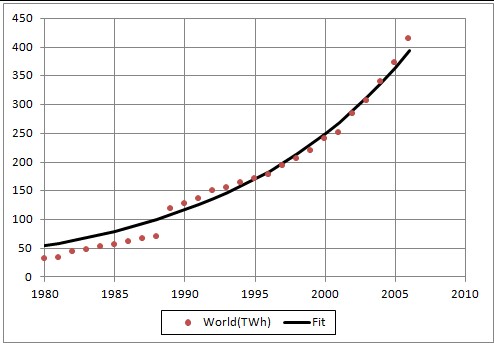
The United States Energy Information Agency (USEIA) gives numbers for the world renewable energy consumption for 1980-2006. (World Net Geothermal, Solar, Wind, and Wood and Waste Electric Power Consumption, 1980-2006)
In this study I use those world data to project into the future.
I also have studied several different types of renewable energy and have projected them into the future. Those projections add up to more than the "renewable energy" projection mentioned above.
The method used in all these fits is to fit the cumulative availability of a given type of renewable energy for given years with the hyperbolic-tangent function (often called the "S curve"). To do this some estimate of the asymptote for the function must be obtained.
The fits given here involve fitting the hyperbolic-tangent function,
![]() ,
,
by varying its three parameters to the estimated renewable-energy consumed in Terrawatt-hours each year.
Renewable energy is in such an early stage of exponential growth that fitting the yearly data does not determined the eventual amount to be produced.
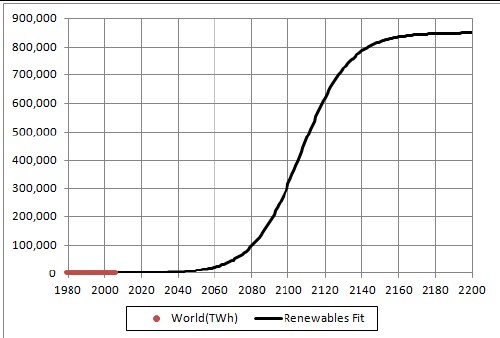
In a previous study I assumed that the asymptotic world energy consumption could be about 12 kW per person, with an asymptotic world population of 8.3x10⁹ people. (12 kW per person is about the current energy consumption in the United States now, 2009.) This corresponds to an asymptotic energy consumption of about 850,000 Terrawatt-hours per year. So I did a fit to the renewable-energy data using 850,000 Terrawatt-hours as the asymptotic value.
This shows the fit to the renewable-energy data for an asymptotical value of 900,000 Terrawatt-hours per year. |
This shows the projection of the fit into the future. |
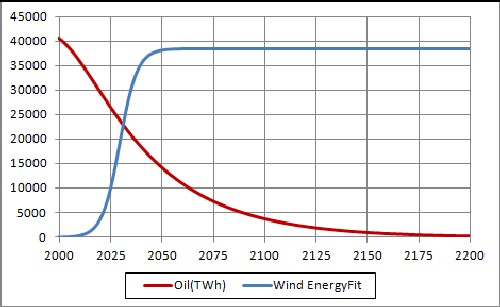
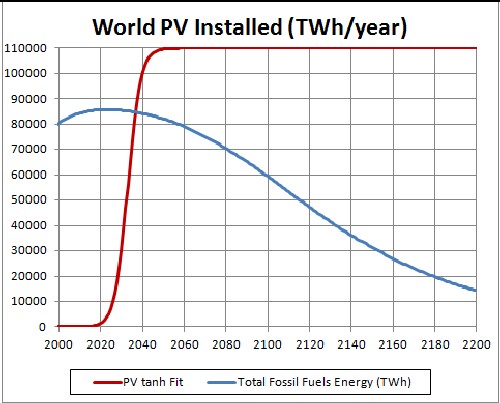
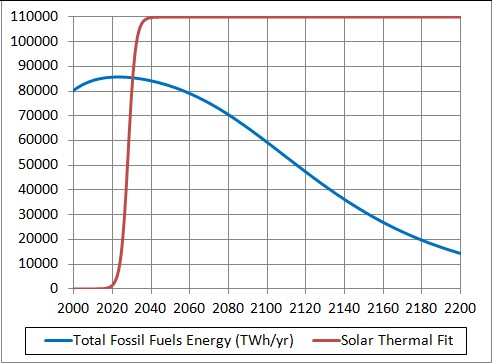
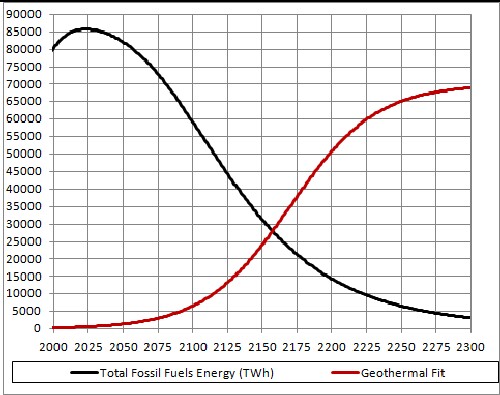
The following graph compares the projection into the future for world renewable energy to the energy available from fossil fuels:
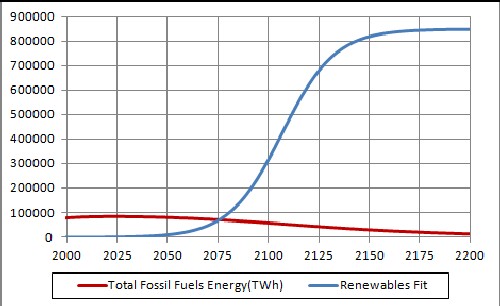
The crossover year is about 2075.
The following graph compares renewable energy for the United States compare to the world:
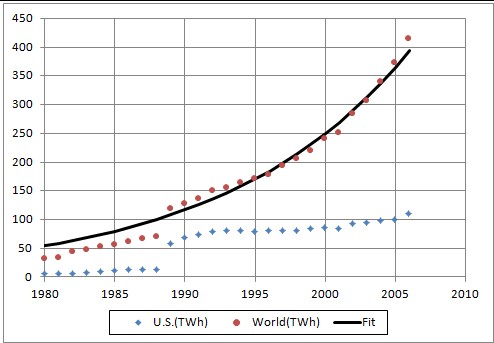
The average change per year from 1995 to 2006 is 2.8% for the United States and 8.1% for the world. If the U.S. is subtracted from the world, the average change is 12% for the rest of the world, more than four times the U.S. change. I leave it to the reader to surmise what that implies for the future of the United States. For 2006 both were 11%.
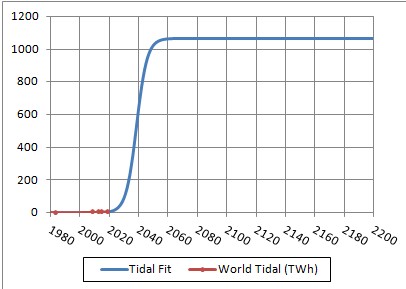
This is small compared to the other newable-energy sources. However, it may be very effective for localities.

 |
|
The following graph shows the data for world renewable energy:
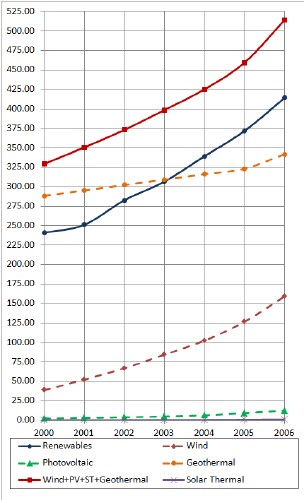
Note that the sum of the wind, solar photovoltaic, solar thermal and geothermal data is larger than the "renewable" data (geothermal, solar, wind, and wood and waste electric power); the difference is about a factor of 1.28. Obviously, the different methods used to estimate those data are not compatible. However, it is interesting that the slopes are very close to being the same.
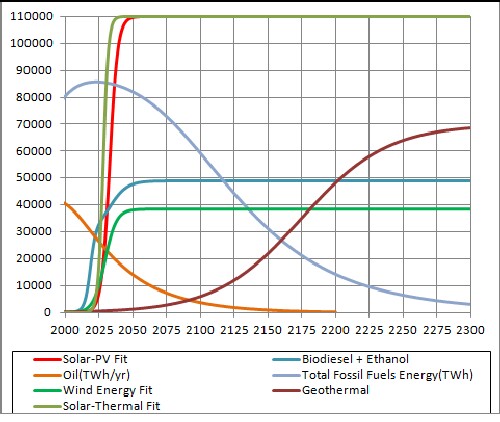
The following graph shows the projections for world renewable energy:
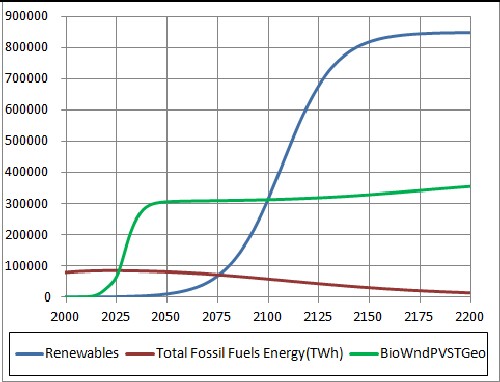
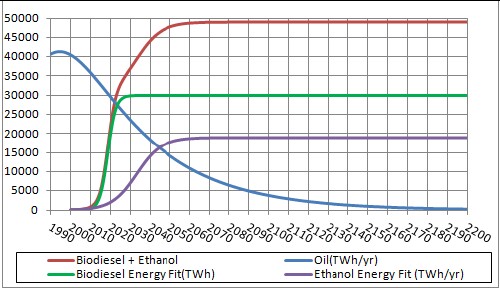
Note that the data used in the "Renewables" fit did not include biofuels and the BioWndPVSTGeo data did; also the "Renewables" data included wood and waste and the BioWndPVSTGeo data did not. Neither included hydroelectric power nor tidal energy. I would guess that the BioWndPVSTGeo needs to be increased by about 25% to include the remaining renewable energies. That would put the year 2200 projection at about 469,000 TWh, which would correspond to about 6.5 kW per person for 8.3x10⁹ people. The current world average is about 2.5 kW/person. The "renewables" fit assume 12 kW/person.
An estimate have been given for future world renewable-energy consumption such that the average consumption is about 12 kW per person, similar to the United States consumption now (2009).
The assumption for a renewable-energy asymptote of 12 kW per person is about double (6.5 kW per person) the estimates for the asymptotes of wind energy, solar-photovoltaic energy, biofuels energy and geothermal energy.
It will be interesting to see in the coming decades how much renewable-energy production increases.