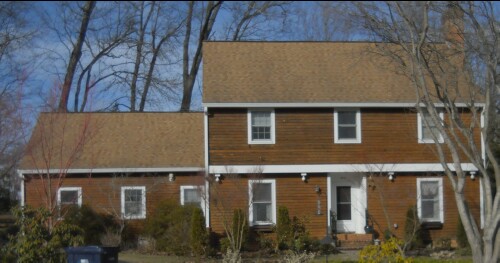
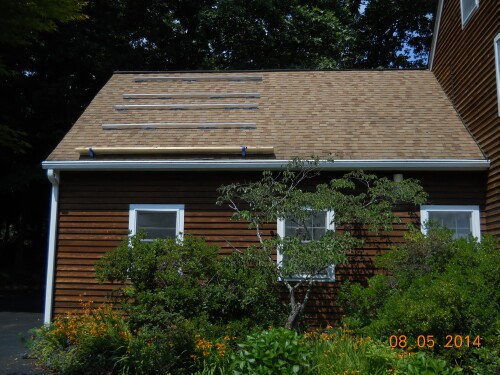
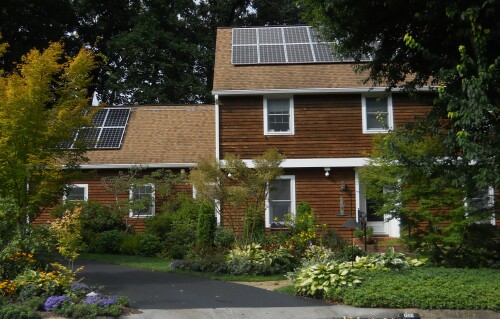
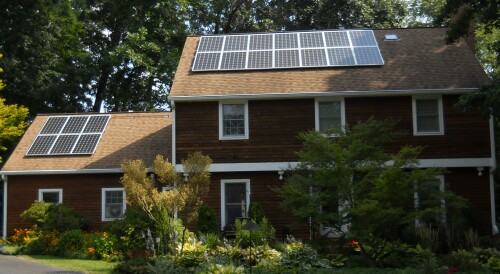
A tall tree on the right-front of the house was removed and later one from the front of the house.
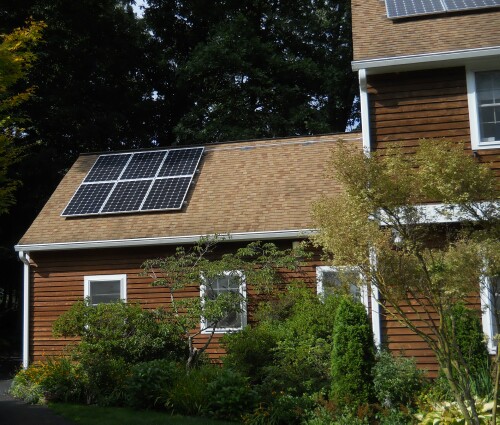
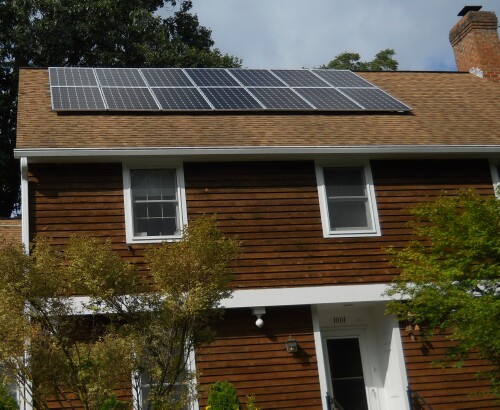
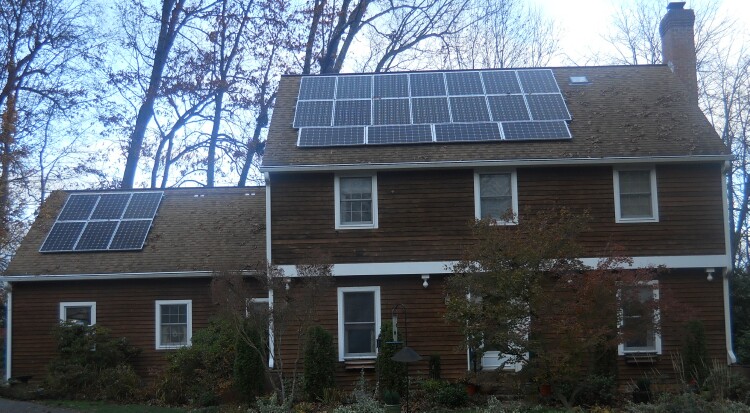
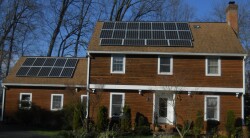
PV roof faces ~20° west of south and tilts ~40° from horizontal.
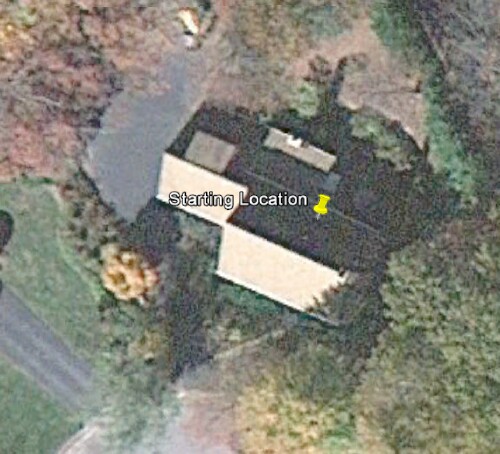
Latitude: N37.205°; Longitude: W80.455°
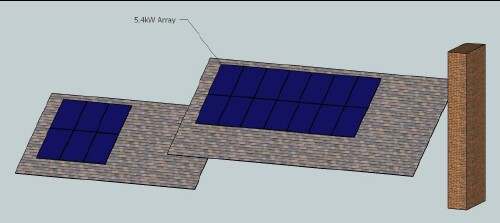
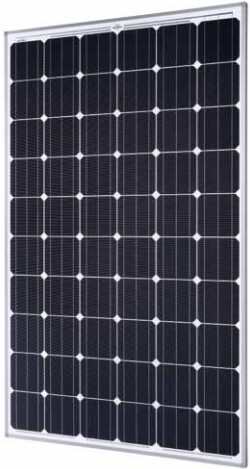
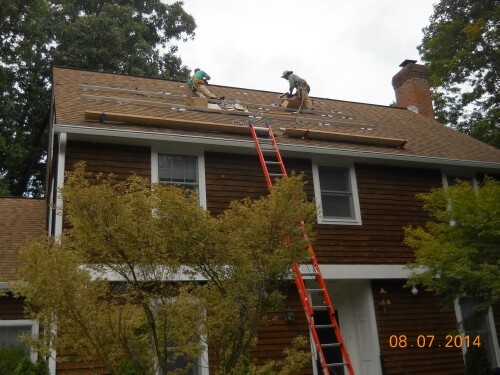
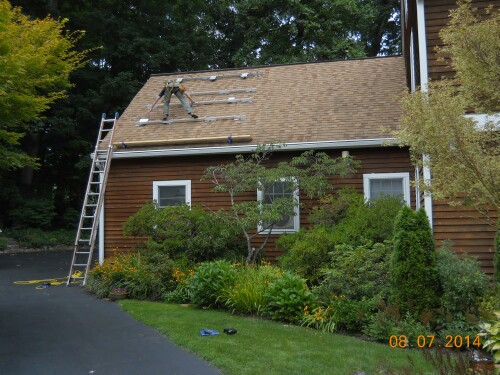
The PV system started with a 5.4 kW Photovoltaic array: twenty 270-W SolarWorld panels in August 2014, twenty Enphase microinverters because of some shading, Pro-Solar roof mounting hardware, all additional disconnects and other balance of system components for a code-compliant installation. In November 2015 four more 285-watts panels were added. In March 2016 four more 290-watts panels were added for a total of 7.7 kW.
This grid-tie PV system will supplement the electrical needs of our house. The system will be connected to our house’s electrical service as well as to the AEP grid in a net-metering arrangement. Usually all of the power produced by the array will be consumed directly by our house. During those times when the panels are producing more electricity than our house is consuming, the excess electricity will flow back out into the grid and will turn our meter backwards. We will receive a credit against our next month’s bill for all excess electricity the system generates. The system operates fully automatically and requires no routine daily maintenance.
5.4 kW is ~34% of the needed power (~2200 kWh/month @ ~4.5 full sunlight hours/day = ~16 kW). However, the orientation is not optimal and there is shade in the mornings and evenings. The actual data show that the collected solar energy is ~22% of the usage. The reduction from optimum due to orientation is 1 - cos(20°) x cos(40°-37.205°) =1 - 0.939 = 0.061, which reduces ~34% to ~32%. So, the reduction due to shade is ~32% - ~22% = ~10%.
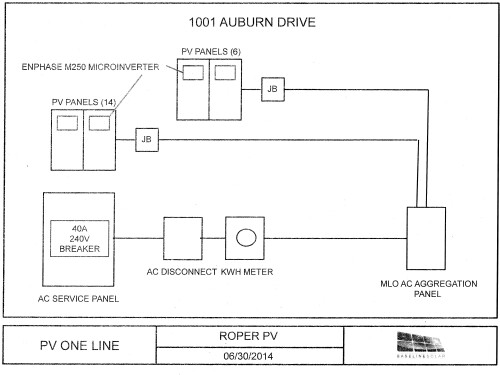
The MLO AC Aggregation Panel is in the attic; it has a circuit breaker in it. Below it is an outlet into which the Enphase Envoy Communications Gateway module is plugged. A small module in plugged into an outlet in the computer room and is connected to an Internet port.
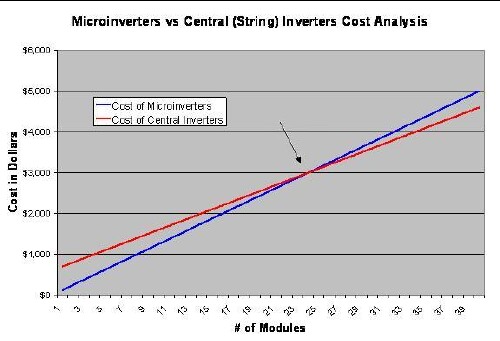
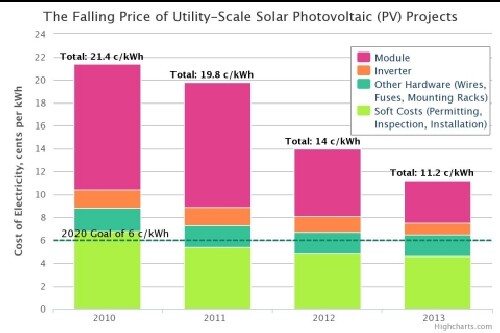
Micro-inverters do cost more: about $0.52/peak-watt versus about $0.40/peak-watt for a central inverter.
Micro-inverters convert the ~30-volts DC to 120-volts AC for each of the 20 panels.The AC output from each panel are connected in parallel to the house circuit.
http://pdf.wholesalesolar.com/inverter%20pdf%20folder/M250-Installation-Operation-Manual.pdf
Based on our utility bills, our consumption average is ~2,200 kWh per month, and our average cost for electricity is ~$0.115 per kWh. At average 4.5 hours of full sunlight per day for Blacksburg, the solar power needed for full use age is ~16 kW.
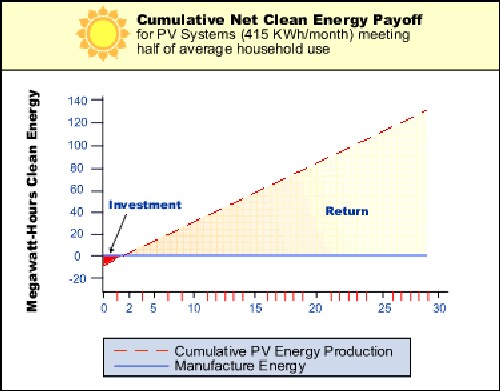
Taking into account partial shading, orientation, and tilt angle of our roof, our system is estimated to produce an average of 450 kWh per month. Production will be higher in the summer and lower in the winter. This will offset approximately 18% of our current monthly usage. The offset will increase as the cost of grid electricity increases in the future. About one-half of the solar energy will be used to charge the Roper electric car.
Over its 30 year anticipated lifetime, our PV system will:
Once installed, the PV system requires no regular maintenance. The panels will self-clean in the rain and the inverter will automatically reset itself during and after utility interruptions. The only scheduled maintenance will be inverter replacement estimated to occur about year 25 for micro-inverters. All of the panels and mounting hardware are designed to withstand winds up to 90 mph, and to meet all applicable building codes for expected snow loads in our area. All roof penetrations will be properly flashed and will be watertight
An additional potential revenue stream may be available through the sale of Solar Renewable Energy Certificates (SREC). One certificate is earned for each 1000 kWh of solar electricity generated. Utility companies in some states are required to generate a certain percentage of their power from renewable sources like solar, and to meet this requirement, they can often purchase SREC’s from individuals with renewable generators.
At the time of installation of the Roper PV System, SRECs could be sold only to the state of Pennsylvania at a low price of ~$30/SREC.
http://news.energysage.com/srec-prices-explaining-u-s-srec-solar-market/
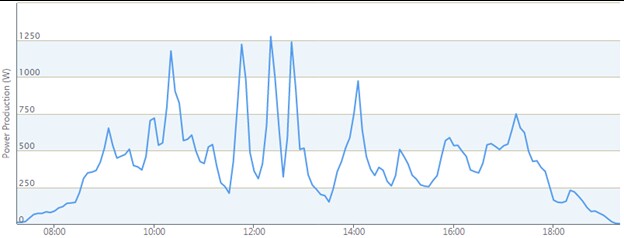
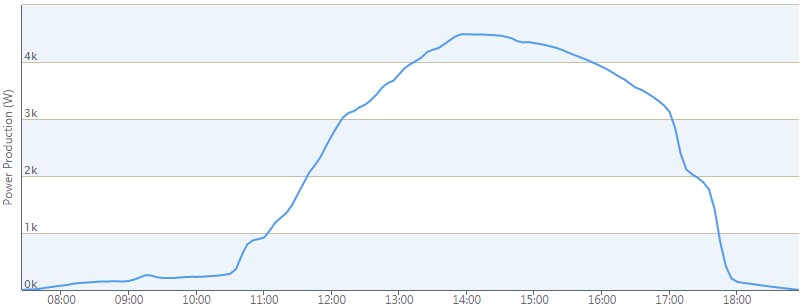
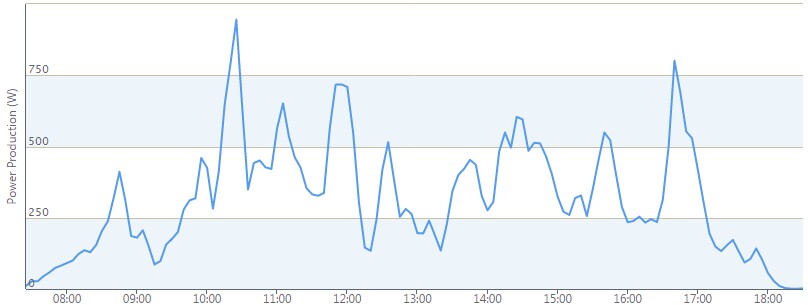
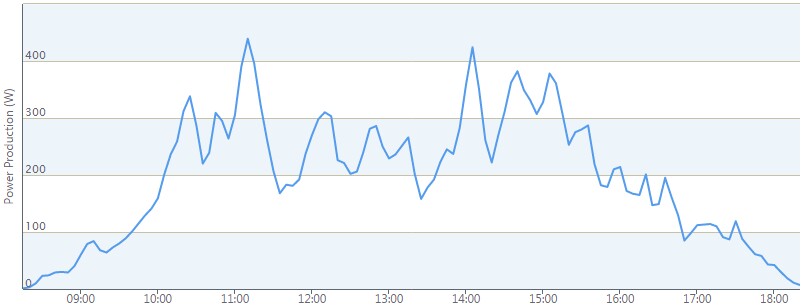
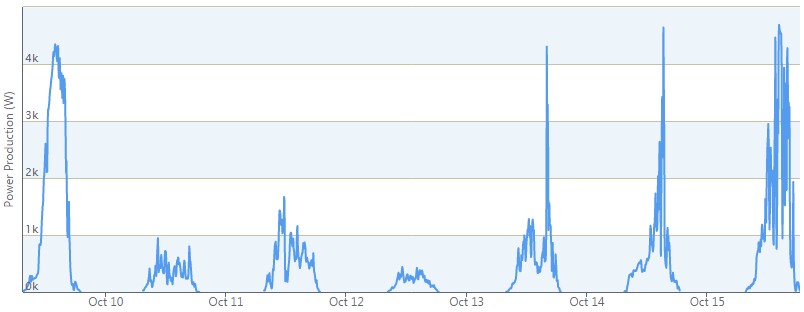
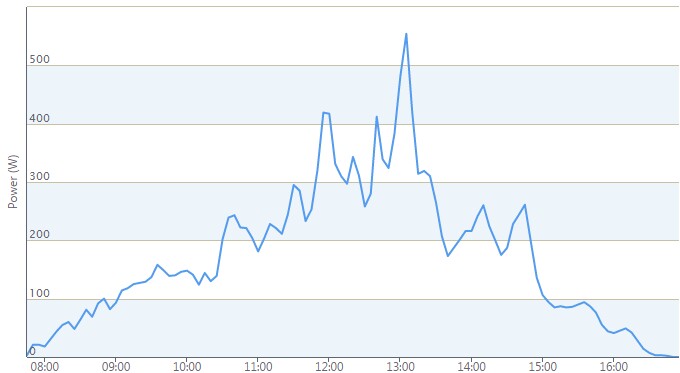
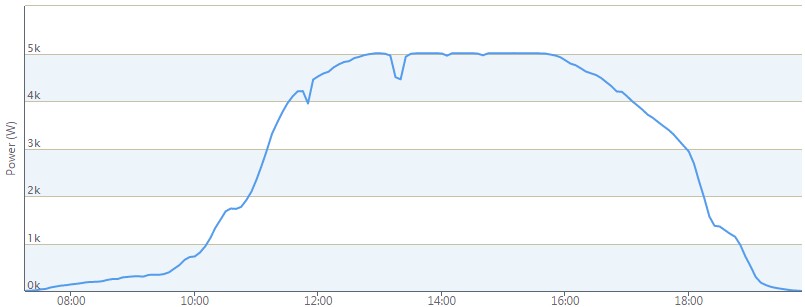
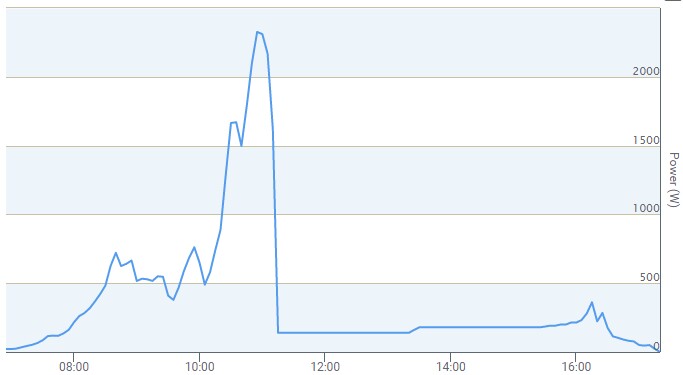
The Enphase microinverters constantly send information about their performance to Enphase which makes them available through Enlighten software called MyEnlighten. Power data are displayable at 5-minutes intervals. Example:
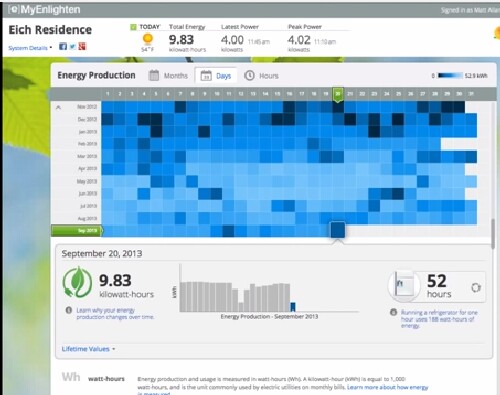
Each square shows the power output for a specific day of the month.
The small graph for a specific day of the month at the bottom can be exchanged
for the large month graph.
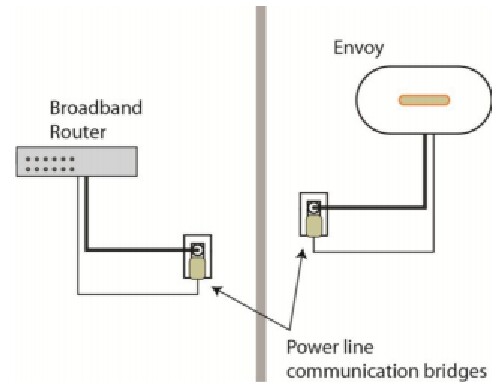
"The Enphase Envoy Communications Gateway is the networking hub connecting every module and micro-inverters of an Enphase system to Enlighten monitoring and management software." Envoy data sheet
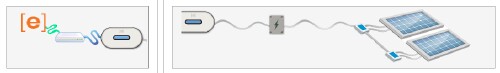
The left-hand side shows the Envoy module connected through the internet to an Enphase computer; the internet connection is done through house wiring to from an Enphase power-line-communication bridge near the Envoy device to another one in the house computer room that is hard wired to an internet router connected to the cable modem. The right-hand side shows the Envoy module connected through house wiring to the 20 micro-inverters.
 |
Junction box and Envoy in attic: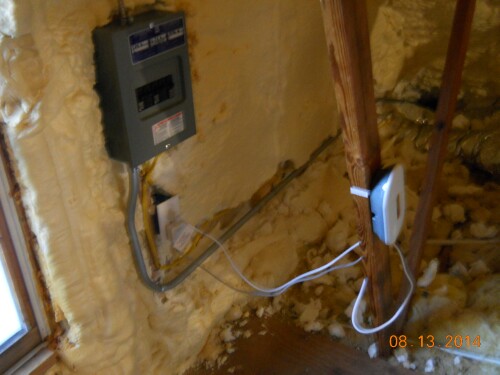 |
|---|
Movies about Enlighten:
To see the output for each panel the owner has to purchase Enlighten Manager for $250. It is available for computers and smart phones.
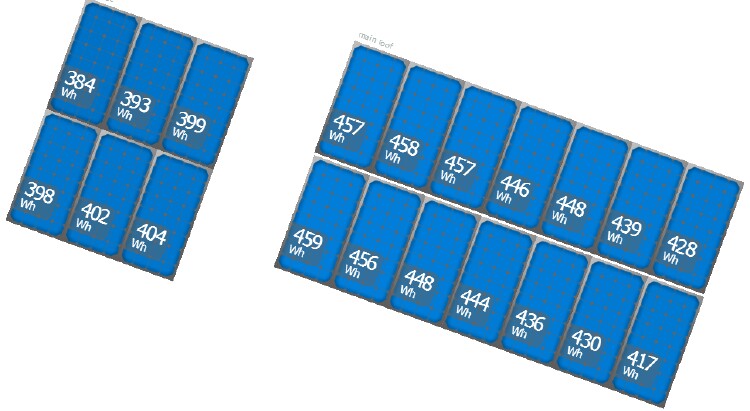
Arrays shown in Enlighten Manager:
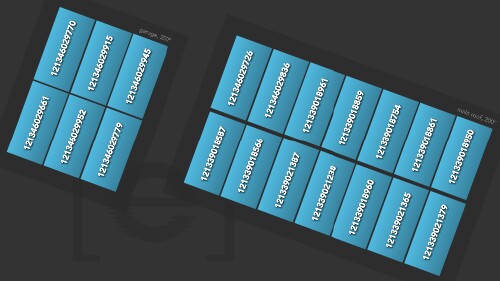
Each panel shows the micro-inverter's serial number.
Arrays' size: Garage: 19.8' x 11'; Main roof: 46.2' x 11'
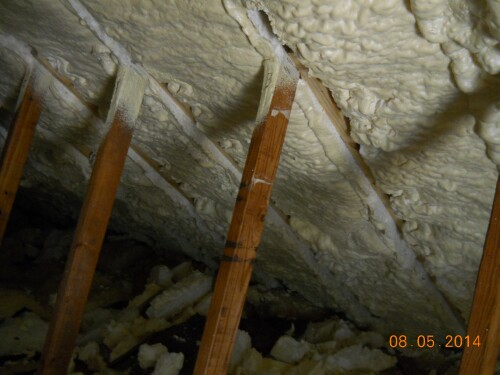
In early morning the locations of the micro-inverters behind the panels can be seen due to condensation:
Here is a sample bill from American Electric Power (AEP):
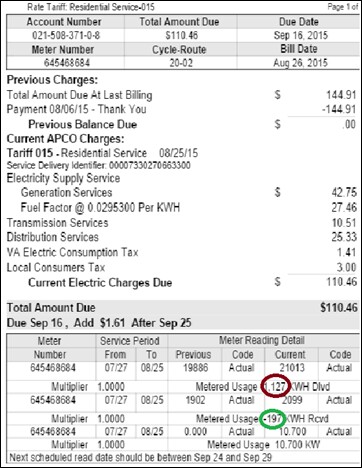
The amount circled in red is the 1,127-kWh obtained from AEP and the amount circled in green is the solar 197-kWh sold to AEP; so the amount bought from AEP is 1,127 - 197 = 930 kWh. The $ amount paid was $110.46, so the effectie rate was $110.46 / 930-kWh = $0.119/kWh. The total amount of solar energy collected is not shown on the bill; that has to be read from the PV meter or downloaded from the inverter-company, Enphase. For the month it was 673-kWh, so 673-kWh x $0.119/kWh = $80.09 was saved by having PV solar.
The amount used is (kWh bought from AEP) + (kWh solar collected) - (kWh solar sold to AEP) = 930 + 673 - 197 = 1406 kWh.
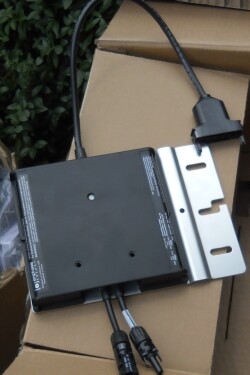 |
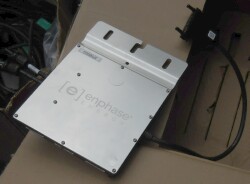 One of the 20 microinverters |
|---|
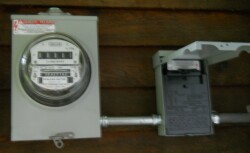
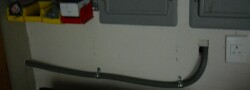 Wire into house from meters |
|
|---|---|
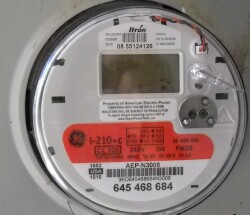 AEP Solar Meter |
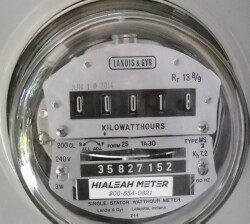 PV meter |
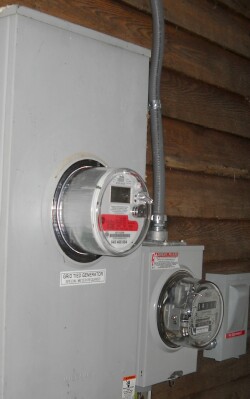 After the 8888888 AEP meter reading the next reading is the amount bought and the next reading is the amount sold. The amount used is the amount bought plus the amount collected shown on the PV meter.
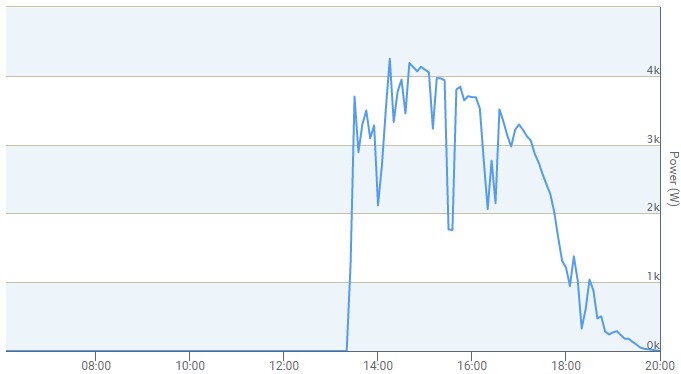

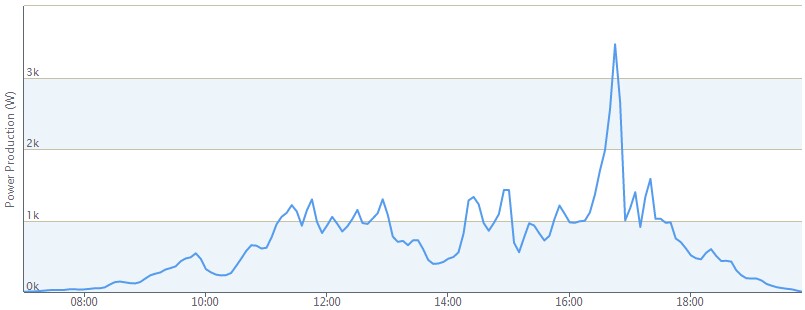
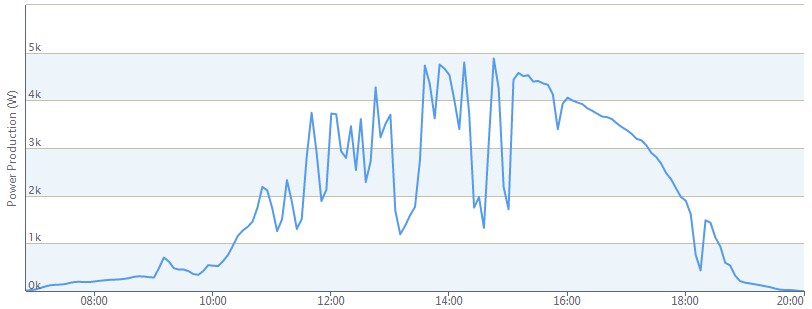
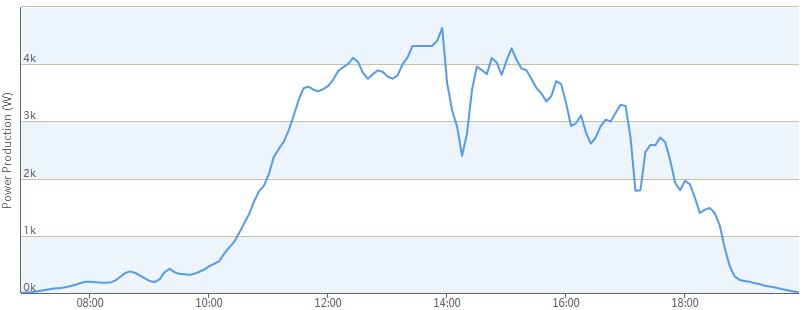
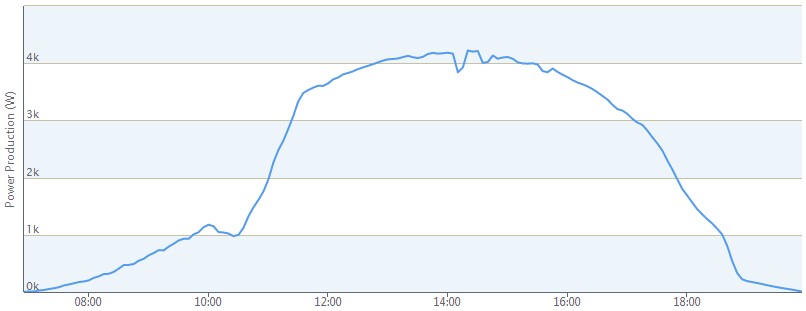
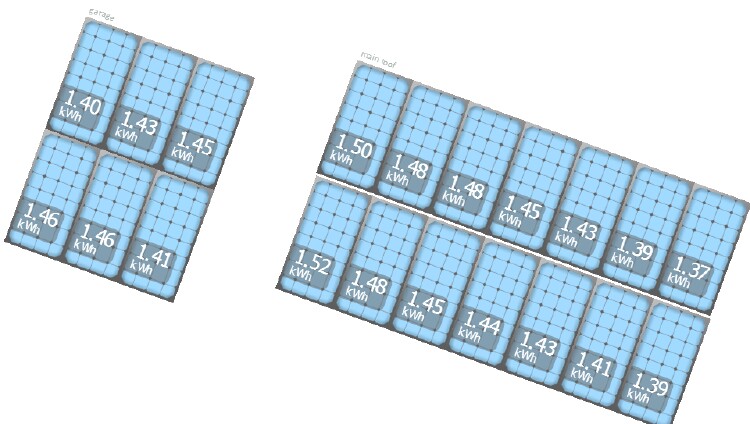
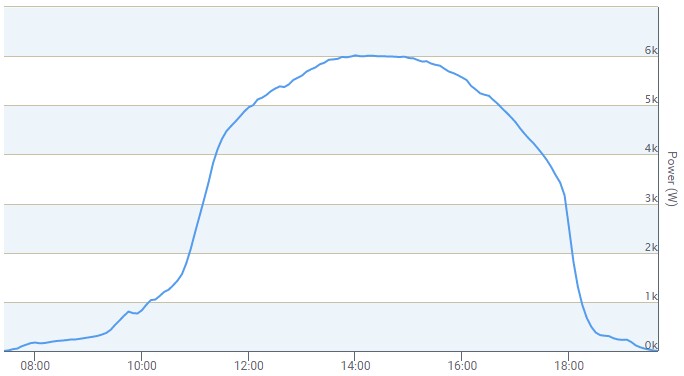
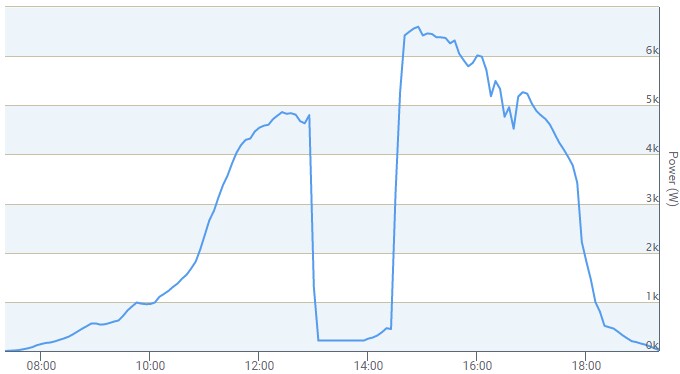
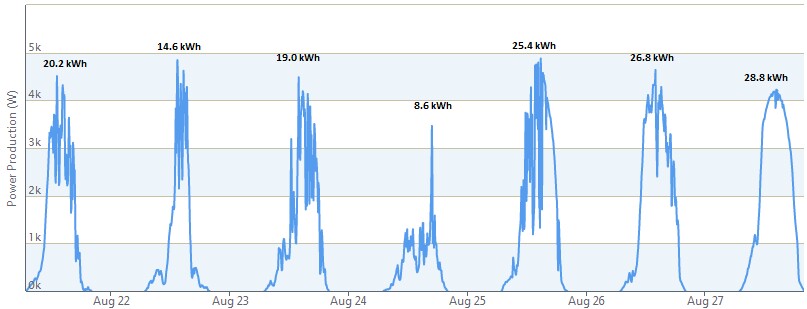 The energies given above each day's power curve is the area under the curve.
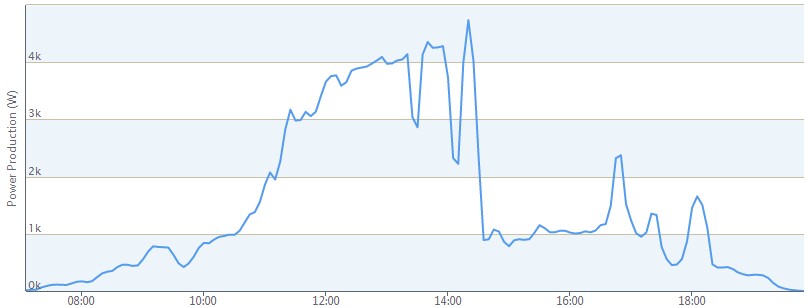
 Note the cable near the top of garage that feeds into the junction box in the attic. |
 |
|---|---|
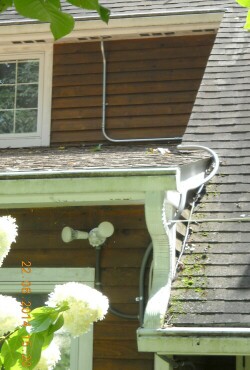 Feedout cable from junction box in attic to PV meter |
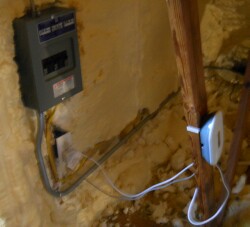 Junction box, feedin and feedout cables and Envoy module in attic. The cutout foam was re-foamed later. |
 |
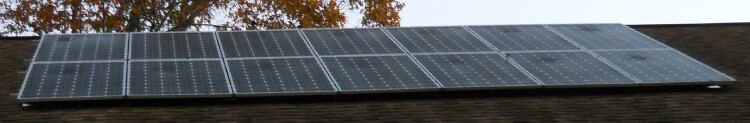
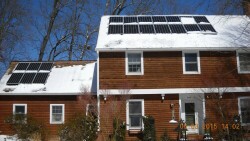 The snow usually slides off of the panels before it slides off of the roof. |
 4 extra 285-kW panels added to house. |
 4 extra 290-kW panels added to garage. |
The connecting cable to the meter and the electrical box in the garage runs down the back roof.
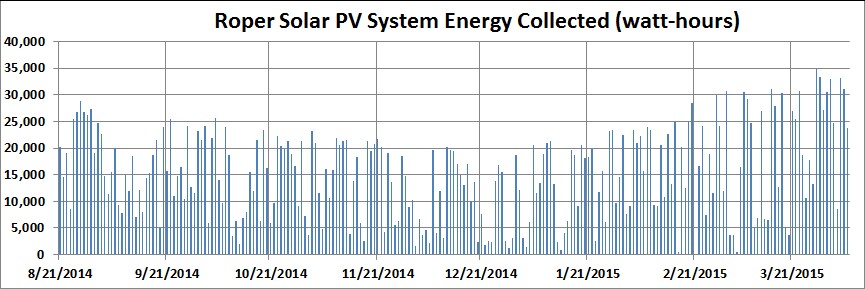
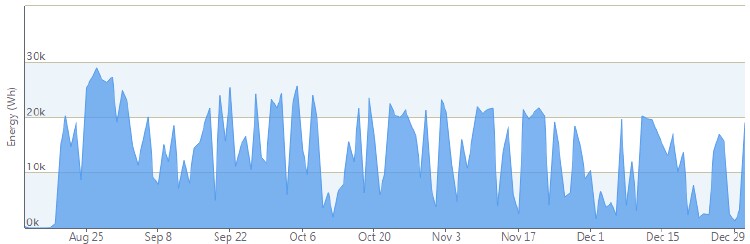
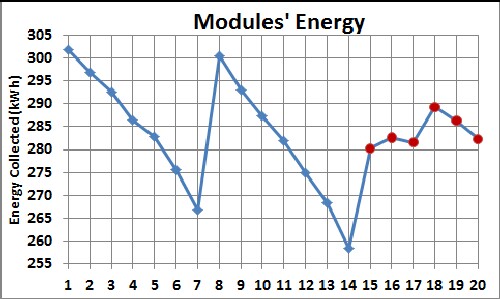
This shows the energy collected in kWh for the twenty panels for the first 11 month of operation:
Date |
MW |
Price |
3 December 2014 |
1 |
$46.50 |
11 March 2015 |
2 |
$48.36 |
1 May 2015 |
3 |
$46.50 |
17 July 2015 |
4 |
$27.90 |
18 September 2015 |
5 |
$17.67 |
15 December 2015 |
6 |
$14.88 |
15 December 2015 |
7 |
$14.88 |
5 January 2016 |
8 |
$17.20 |
20 April 2016 |
9 |
$13.95 |
4 May 2016 |
10 |
$13.95 |
9 June 2016 |
11 |
$12.09 |
11 October 2016 |
12 |
$10.23 |
19 October 2016 |
13 |
$8.37 |
19 October 2016 |
14 |
$8.37 |
8 December 2016 |
15 |
$7.44 |
1 August 2017 |
20 |
$10.00 |
22 August 2017 |
21 |
$2.25 |
19 October 2017 |
23 |
$6.00 |
21 March 2018 |
25 |
$12.00 |
4 April 2018 |
26 |
$6.00 |
3 May 2018 |
27 |
$6.00 |
Calculating payback for a photovoltaic system is difficult and yields uncertain results. Modern society demands putting a $ price on everything, so I will try to do that here year by year. Some factors to consider are:
The most important "payback" to me is reducing the carbon emissions due to using electricity. Since modern society demands putting a $ price on everything, a reasonable $ price on reducing carbon emissions is $50/ton of CO2 with a 3% rise per year.
The first year of operation saved about 4.7 tons of carbon emissions, which is equivalent to ~17.2 tons of CO2 (ratio = ~3.67) emissions; its price is ~$860 for the first year of operation. So, for the first 10 years of operation at 3% increase/year $s saved are:
Year: |
1 |
2 |
3 |
4 |
5 |
6 |
7 |
8 |
9 |
10 |
Total |
$ saved: |
$860 |
$886 |
$912 |
$939 |
$968 |
$997 |
$1027 |
$1058 |
$1089 |
$1122 |
$9,859 |
A recent detailed study of social cost of global warming calculates the reparation cost at $220/ton of carbon dioxide emitted, 4.4 times the $50 I assumed above!!
During the first year of operation the price of electricity hovered around $0.115/kWh. In the previous decade it had approximately doubled. I don't think that will continue because AEP will be moving from coal to less expensive natural gas and then to even less expensive commercial solar and wind. So, instead of ~10% increase/year as for the last decade, I use 3%/year as I did for the price of carbon emissions.
The first year of operation collected ~6190 kWh. So, assuming this value/year for the next ten years and starting at $0.115/kWh price and increasing it at 3%/year, calculated monthly $s saved are:
Year: |
1 |
2 |
3 |
4 |
5 |
6 |
7 |
8 |
9 |
10 |
Total |
$ saved: |
$712 |
$733 |
$755 |
$778 |
$801 |
$825 | $850 |
$875 |
$902 |
$929 |
$8,161 |
This calculation does not include funds received by selling SRECs, since they can vary widely. For the first year of operation the Roper PV system's 4 SRECs sold for $168. If we assume that for each year 4 SRECs will sell for a total s $150, the monthly $s saved would be:
Year: |
1 |
2 |
3 |
4 |
5 |
6 |
7 |
8 |
9 |
10 |
Total |
$ saved: |
$862 |
$883 |
$905 |
$928 |
$951 |
$975 | $1000 | $1025 |
$1052 |
$1079 |
$9,661 |
The total $s saved calculated monthly due to the price of carbon emitted and the cost of the collected solar energy are:
Year: |
1 |
2 |
3 |
4 |
5 |
6 |
7 |
8 |
9 |
10 |
Total |
$ saved: |
$1722 |
$1769 |
$181 |
$1868 | $1919 |
$1972 | $2027 |
$2083 | $2141 |
$2201 |
$19,519 |
The cost of installing the PV system was $21,388.62 including some rafter changes needed. After the 30% tax credit, the cost was $14,972.03. This corresponds to the amount of savings by ~5 years.
If I were a bank perhaps I could have lent the $14,972.03 at 3% interest; calculated monthly it would have accumulated over the next ten years as:
Year: |
1 |
2 |
3 |
4 |
5 |
6 |
7 |
8 |
9 |
10 |
$ earned: |
$449.16 |
$462.64 |
$476.51 |
$490.81 |
$505.53 |
$520.70 |
$536.32 |
$552.41 |
$568.98 |
$586.05 |
Total |
$15,421 |
$15,884 |
$16,360 |
$16,851 |
$17,356 |
$17,877 |
$18,414 |
$18,966 |
$19,535 |
$20,121 |
Including this the payback would be ~9 years.
For many years my MO has been to spend my funds for things that improve the environment (e.g., see http://www.roperld.com/science/composter.htm and http://www.roperld.com/science/drywells.htm and an electric car ), without calculating $ paybacks. So, even if the carbon price payback did not exist, I would have installed a PV system on our house.
The same reasoning is why we drive a Tesla Model 3 Long-Range RWD and a Toyota RAV4 Hybrid. Our second car may eventually be a SUV PHEV, preferably with a biodiesel engine. Some SUV PHEVs that soon will be available in the U.S. are Mitsubishi Outlander PHEV, Volvo XC90 PHEV, Audi Q7 PHEV, Mercedes GLE550 e PHEV, Volkswagen CrossBlue PHEV and Porsche Cayenne S e-Hybrid PHEV. See http://www.roperld.com/science/BEVvsICECost.htm.
In November 2015 four SolarWorld 285-watts mono panels were added sideways below the house-roof panels:
This made the total peak power 6.54-kW. This is ~41% of the needed power (~16 kW).
This 11-months' solar energy collection graph indicates that adding 2 or 4 panels to the right of the garage panels would be effective:
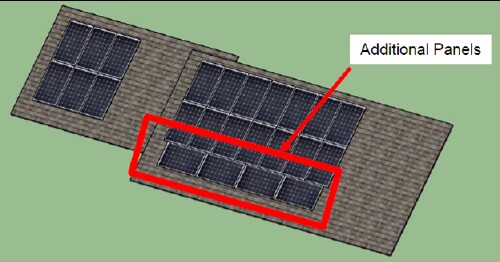
This graph and picture indicate that 4 more panels could be add to the right of the 6 panels on the garage roof.
Here is my best guess of what the solar energy collection for 11 months for the 8 extra panels would be:
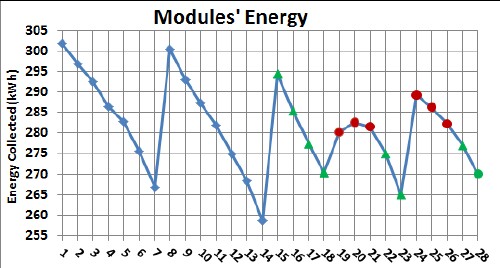
The green triangles are for the extra 8 panels.
The energy increase is ~39%. The peak power is 7.68 kW. This is ~48% of the needed power (~16 kW).
In March 2016 four SolarWorld 290-watts mono panels were added beside the 6 garage-roof panels:
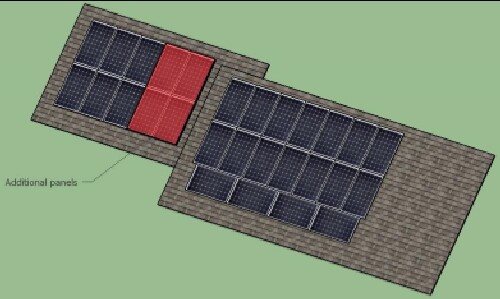
This made the total peak power 7.7-kW. This is ~48% of the needed power (~16 kW).
There is a small roof near the top of the back of the house on which 2 or 3 PV panels might be placed:
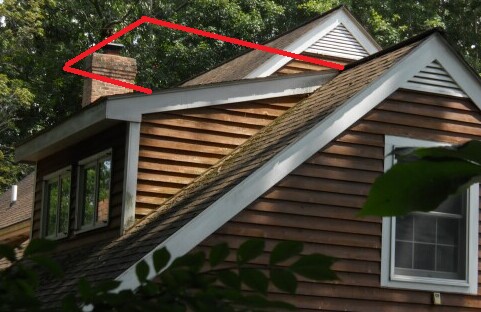
It appears that the small roof is about 10° north (-10° south) from the horizontal.
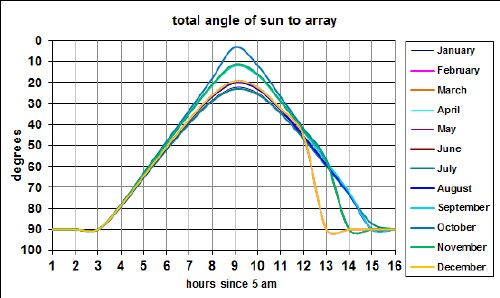
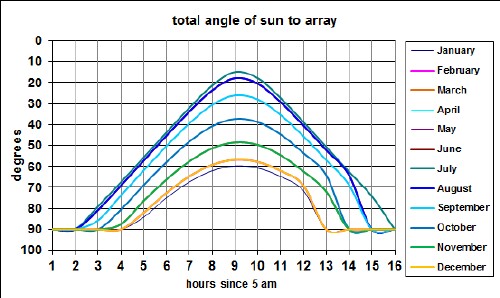
The Sun angle for panels at 40° from the horizontal at our latitude of N37.205° and 20° south house orientation averaged over each month at different times are:
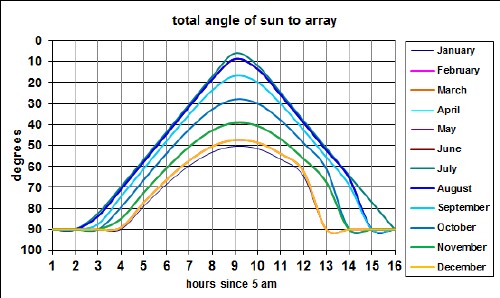
If these new PV panels are installed flat on the back small roof at about -10° from the horizontal, the monthly Sun angles at different times would be::
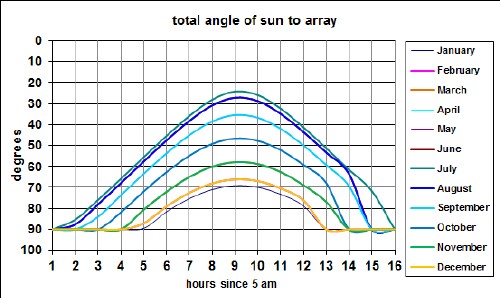
This would collect more of the early and late solar energy.
It may be desirable to bracket the north end of these new panels to raise them higher than -10°. Of course, the north end could be raised to the 40° angle of the 24 panels. If the future panels were at 0° the Sun angles would be:
If the future panels were at +10° the Sun angles would be:
There is some morning and evening tree shade for the original panels. Panels on the small roof will have less morning tree shade.
Adding two panels on this small roof and having 26 panels previously installed would come to 7.68 kW peak power. This would be ~48% of the needed power (~16 kW).
2 more panels could be to the right of the garage panels, with would give a total peak power of 8.25 kW, ~52% of the needed power.
 |
|---|
 |
The original 20 panels of the Roper PV system (6 on outside of garage roof and 14 on house roof) are each 270-watts, the bottom 4 sideways panels on the house are 285-watts and the 4 panels on the house-side of the garage roof are 290-watts. (There is a light tube at the top right of the panels on the house to direct sunlight into a dark stairway.)
My reasons for installing the PV system are, in order of importance:
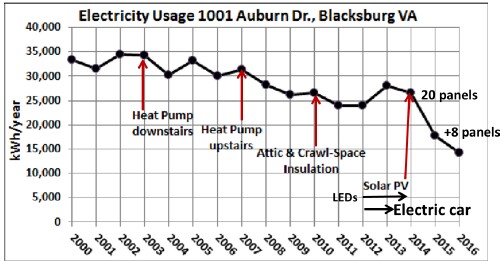
The house was built in 1983, so the windows are double glass. Before installing the PV system an energy audit was done to discover changes that needed to be made and fix them, high-efficiency heat pumps were installed, the attic and crawl space were insulated and mostly LED lights were installed. Installing a PV system was the logical next step. See http://www.roperld.com/science/RoperPVSystem.htm .
The neighborhood organization of Hethwood quickly approved installing the system and the two additions to it.
The next step will be to install a lithium-ion battery in the garage to supply electricity for kitchen appliances and a heater in cases of power outage.
http://www.roperld.com/science/roperpvsystemshade.pdf
L. David Roper, http://www.roperld.com/personal/roperldavid.htm
5 October, 2019