L. David Roper
http://arts.bev.net/roperldavid
6 April, 2016
One can learn much about atmospheric circulation and global heating by studing the variation of precipitation as a function of latitude and longitude.
There is an extensive set of monthly precipitation rates (kg/m2/s) from 1948 to 2009 as a function of latitude and longitude. I use these data in the analyses below. (The data unit is kg/m2/s multiplied by 86400.)
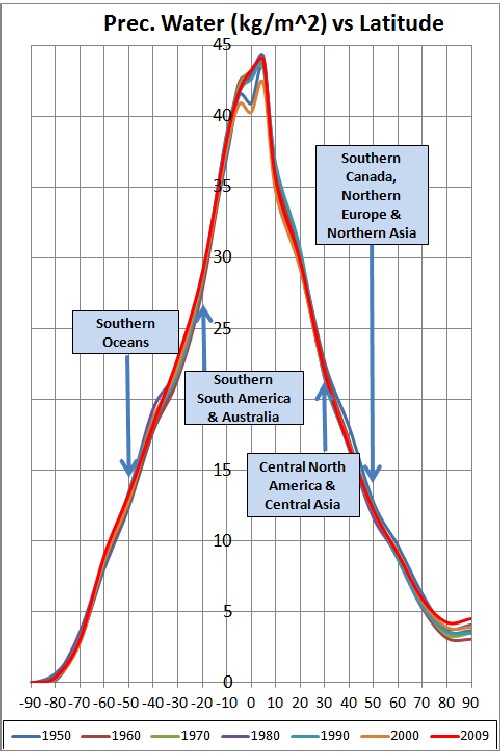
There are also precipitable water (kg/m2) data. Wikipedia: "...the amount of water in a column of the atmosphere." Some of this water vapor precipitates out to the surface and some remains in the atmosphere,where it serves as a very potent greenhouse gas. I use these data in the analyses below.
There is an extensive set of precipitation data (inches, which I convert to meters) for each state in the United State from 1895 to 2009. I use these data in the analyses below.
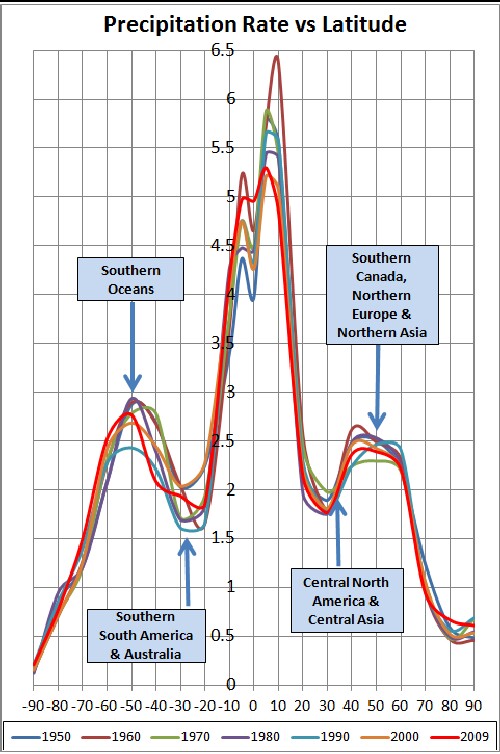
I extracted precipitation data and precipitable-water data for 10°-latitude points averaged over all longitudes for each year given by the data (1948-2009). Then I calculated the monthly median for each year and plotted the results for 10-year points for each 10°-latitude point. The results are shown in the two graphs below.
|
|
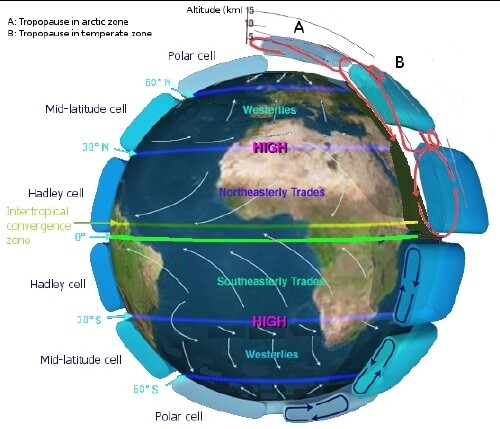
Athough the precipitable water smoothly falls off for latitudes toward the two poles, the precipitation rate has minor peaks at about -50° and 50°, with minima at about -30° and 30°,between the major equitorial peak and the two minor peaks. This is due to atmospheric-circulation cells:
Most of the land mass lies at high latitudes:
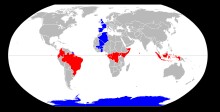
Countries on the Prime Meridian are blue and countries on the Equator are red.
The precipitable water versus latitude is a function of the surface air temperature versus latitude averaged over all longitudes:
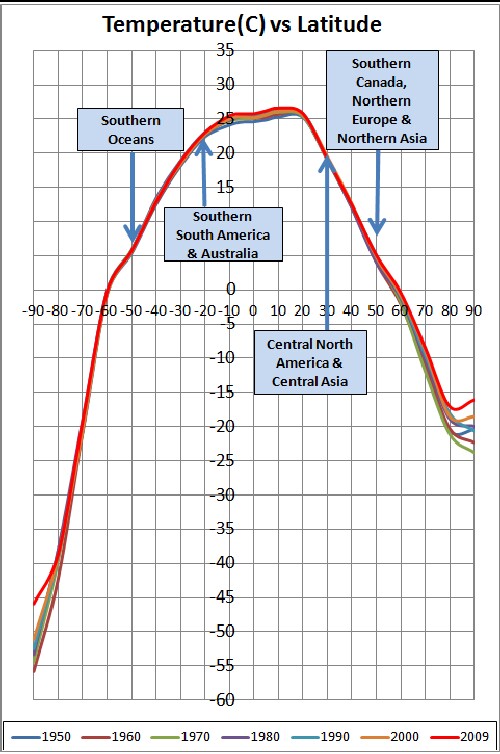
Notice that the temperature distribution over latitude is much broader than the precipitable-water distribution. Also, notice that the 2009 temperature (bright-red curve) is higher than the previous six decades at all latitudes, with the biggest difference at the poles. The polar temperature increase (due to global heating) is the reason that polar ice is melting so rapidly.
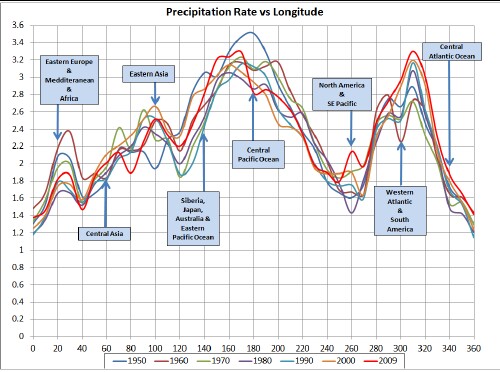
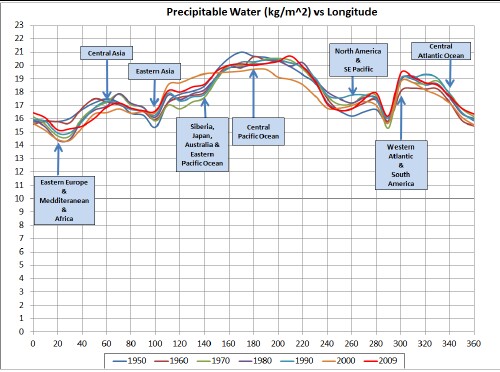
I extracted precipitation data and precipitable-water data for 10°-longitude points averaged over all latitudes for each year given by the data (1948-2009). Then I calculated the monthly median for each year and plotted the results for 10-year points for each 10°-longitude point. The results are shown in the two graphs below.
 |
 |
Note that longitude is measure to the east of the Prime Meridian. About two-thirds of land mass lies at low longitudes; with the remaining about one-third at high longitudes.:
Countries on the Prime Meridian are blue and countries on the Equator are red.
The fractional variation with longitude is much larger for precipitation rate than it is for precipitable water.
The precipitable water versus longitude is a function of the surface air temperature versus longitude averaged over all latitudes.
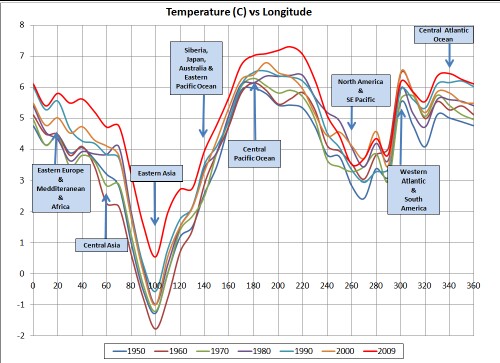
Note that the 2009 temperature (bright-red curve) is much higher than the previous six decades except in the longitude region of the Americas.
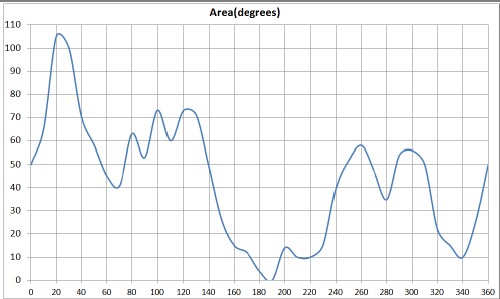
It is interesting to compare the following graph of approximate land area (in latitudinal degrees) to the curves given above:
Roper Global-Heating Web Pages
L. David Roper interdisciplinary studies