L. David Roper
http://www.roperld.com/personal/roperldavid.htm
06-Apr-2016
This referenced article, "The Nuclear Illusion", is a detailed study of the economics of nuclear power past and present. One quote from the article sums up its conclusion: “... nuclear power is continuing its decades-long collapse in the global marketplace because it’s grossly uncompetitive, unneeded and obsolete – so hopelessly uneconomic that one needn’t debate whether it’s clean and safe; it weakens electric reliability and national security; and it worsens climate change compared with devoting the same money and time to more effective options.”
A further quote: “… focusing on these three kinds of central plants (nuclear, coal and natural gas) is obsolete. In today’s market they’re all the wrong competitors, because two other diverse classes of electrical resources are walloping all central plants in the global marketplace. These new competitors are negawatts – electricity saved by more efficient or more thoughtfully timed end-use by customers – and micropower – the Economist magazine’s generic term for two diverse classes of less centralized resources.” The article then list two classes of micropower technologies:
Calculations were done of kWh generated per 2007 dollars and CO2 emissions saved relative to coal per 2007 dollars for various power sources with the following conclusions:
Power Source |
kWh generated |
kg CO2 emissions saved |
Nuclear Plant |
9 |
8 |
Coal Plant |
12 |
0 |
Wind Farms |
14 |
13 |
Building Cogeneration |
17 |
12 |
Industrial Cogeneration |
33 |
31 |
Obviously, local industrial cogeneration is the big winner, followed about equally by local building cogeneration and wind farms, both for producing the most energy per dollar and the most reduction of CO2 emissions per dollar. Energy efficiency (negawatts) values can be comparable to industrial cogeneration for reasonable estimates of its cost per kWh saved. Notice that the power priority (kWh/dollar) is similar to the CO2-emissions priority (kg/dollar).
Many more details are discussed. One of great importance is the long time required to build a nuclear power plant compared to the better options.
One final quote: “Nuclear growth has indeed been overtaken by some of the technologies claimed to be least able to do so – even, ignominiously, by the costliest one, photovoltaics (solar cells). In 2006 worldwide, nuclear power added less net capacity (1.44 GW) than photovoltaics added (1.74 GW), or one-tenth as much as windpower (15.1 GW).”
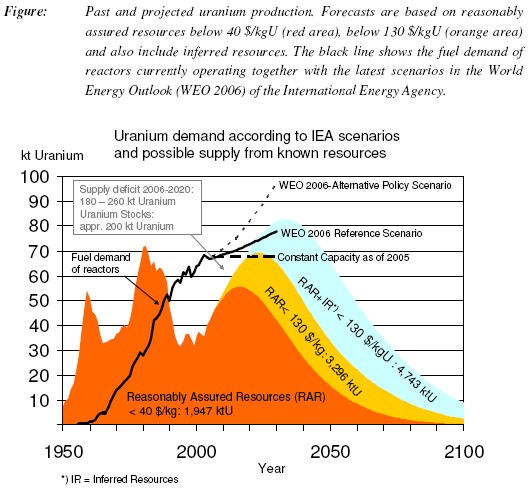
This referenced article, "Uranium Resources and Nuclear Energy",is a study of the availability of uranium and the ability to add new nuclear reactors over the next 25 years. The conclusion is: “The analysis of data on uranium resources leads to the assessment that discovered reserves are not sufficient to guarantee the uranium supply for more than thirty years.” And “At least within this time frame, neither nuclear breeding reactors nor thorium reactors will play a significant role because of the long lead times for their development and market penetration.”
With regard to availability of uranium ore, only Canada has ore with more than 1% uranium. Most other countries have ore with less than 0.1% uranium. The energy required to extract and process uranium for ore increases as a very fast varying function of uranium concentration.
The following graph is shown to compare the projected uranium supply to the uranium demand out to year 2100:
With regard to adding new nuclear power plants, the following quote is relevant: “At present, only 3-4 new reactors per year are completed. This trend will continue at least until 2011 as no additional reactors are under construction. However, the completion of 15-20 new reactors per year will be required just to maintain the present reactor capacity.”
The conclusion of the study is: “… in the short term, until about 2015, the long lead times of new (nuclear reactors) and decommissioning of aging reactors will hinder rapid extension (of nuclear power), and after about 2020 severe uranium supply shortages will become likely which, again, will limit the extension of nuclear energy.”
This referenced article, "Nuclear Power-The Energy Balance", is a detailed study of the energy produced by nuclear power plants compared to the energy used to construct them, mine and process ore for uranium, operate the plants and decommission them after their lifetime. It also discusses to what extent nuclear power can be used to mitigate global warming.
The energy-balance calculation can be diagrammed as follows:
![]()
Efront = the energy inputs for the production of nuclear fuel from uranium ore, including mining the ore and extracting the uranium, during the lifetime of the reactor.
Eback = the lifetime energy inputs of the activities needed to isolate the radioactive waste from the biosphere indefinitely.
The results of the energy-balance calculation for a 1 GW(e) nuclear reactor are summarized in this graph (green lines for different ore grades):
![]()
Edebt = energy input for construction (p) and decommissioning and dismantling (r) and q = energy input of the fuel chain during operation lifetime. Note that the payback time, of course, increases as the ore grade decreases. At some low ore grade the payback period becomes infinite.
There is a long-term CO2 debt for nuclear power: “… the completion of the back end of the nuclear chain will consume fossil fuels and therefore will emit CO2.” “Even if all nuclear power plants of the world were to be closed down tomorrow, the nuclear era will cause large CO2 emissions for at least the next century.”
The following graph shows the CO2 debt, compared with a gas-fired power plant, as a function of the ore grade:
![]()
The crucial ore grade appears to be about 0.01%.
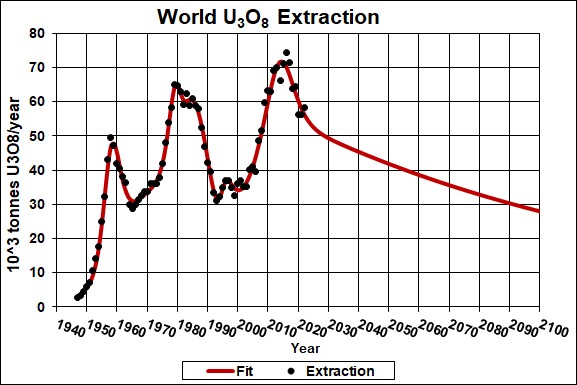
This referenced web site of mine considers the fact that mineable uranium, like any extracted mineral, will eventually deplete.
This graph shows a 3-Verhulst-functions fit to the world uranium extraction-rate data.
When this fit is combined with a fit to the world demand for uranium, the following red curve is obtained.
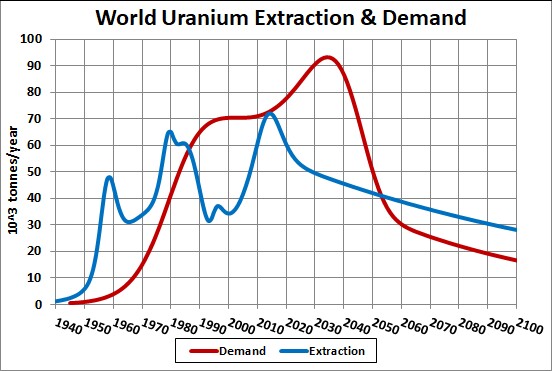
The areas under the two curves, the total amount eventually extracted and used (8,800x103 tonnes), are the same. Notice that, although the peak for uranium extraction is ~2050, the peak for meeting the demand is ~2000. The uranium mined for weapons in the first two peaks was later removed from weapons and used for nuclear power. The fact that the two curves enclose the same area can be seen by plotting the total amounts extracted and used versus time on the same graph:
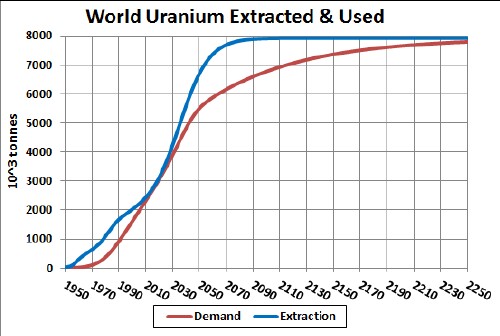
Both curves approach the same asymptote of 8,800x103 tonnes. Note the near bottle neck at ~2020 when the uranium extraction barely meets the demand. This must be a major reason for the recent rise in uranium prices, as show below.
Note that, no matter how fast the remaining uranium is mined, uranium consumption is peaking because of the past use of weapons uranium in power reactors, which kept the price of mined uranium too low for mining to occur. So, now, uranium mining cannot ramp up fast enough to meet the demand.
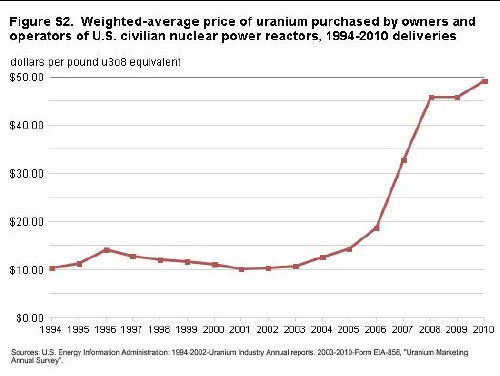
The recent rising crude-oil prices has helped cause a concomitant fast rise in the price of uranium oxide as shown in the graph below (weighted average per pound for U3O8).
An interesting question to ask is how much primary energy is supplied by "burning" uranium in nuclear reactors? The best analysis of energy produced by nuclear reactors (Nuclear Power – The Energy Balance; see above) gives the following constants needed to do this calculation:
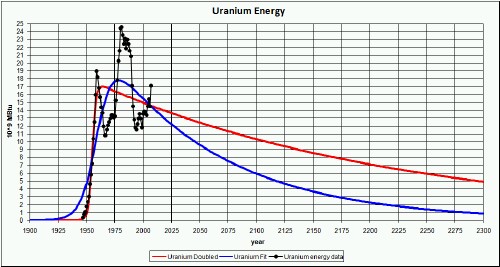
The amount of nuclear thermal energy produced by reactors as a function of time, assuming a very optimistic amount of nuclear resources, is shown in the following graph:
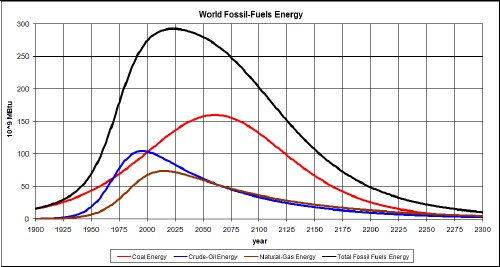
This amount of energy is small compared to the energy still available from fossil fuels, as shown in the follow graph (http://www.roperld.com/science/energy.htm):
Thus, we should not waste energy and capital building more nuclear reactors instead of more effective local cogeneration and renewable energy sources.
This referenced web site, International Panel on Fissile Materials, has links to several articles about uranium-fuel-rods reprocessing. There have been claims that reprocessing nuclear fuel after its first use will greatly increase the energy available from uranium. The articles on the web site show clearly that the cost per generated kWh of electricity is higher when the uranium fuel is reprocessed.
Research reported on other web sites support this economic conclusion.
Comparing the Economics of Nuclear and Renewable Source of Electricity by Dr. Mark Diesendorf
![]()
Nuclear Power Expensive, Uninsurable: Unsubsidized insurance would cost as much as the power itself.
Uranium ( U3O8e) ( Uranium quantities are expressed in the unit of measure U3O8e (equivalent). U3O8e is uranium oxide (or uranium concentrate) and the equivalent uranium-component of hexafluoride (UF6) and enriched uranium.) prices in the United States:
The bottom lines are:
L. David Roper interdisciplinary studies
Roper Global-Heating Web Pages
L. David Roper (roperld@vt.edu) (http://www.roperld.com/personal/roperldavid.htm)