L. David Roper, roperld@vt.edu
http://www.roperld.com/personal/roperldavid.htm
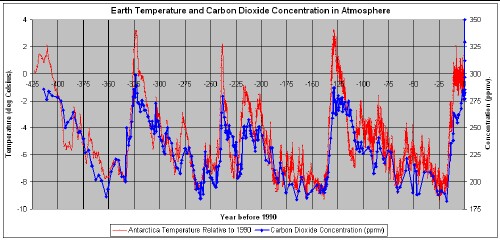
Temperature and carbon dioxide (CO2) atmospheric concentration have been measured for ice cores at Vostok, Antarctica for the last 423,000 years:
Notice that there have been four Major Ice Ages of about 115,000 years duration over the last 425,000 years and that the warm Major Interglacials last only about 10,000 years or less. Homo sapiens evolution from the previous species mostly occurred in the rise to the last Major Interglacial about 150,000 years ago and the fall into the last Major Ice Age about 115,000 years ago.
Also, notice the obvious correlation between the temperature and the carbon-dioxide concentration in the atmosphere. They are mutually positive reinforcing. If one plots the CO2 concentration versus temperature only for rising CO2 concentration, a very scary extrapolation for higher concentrations is seen:
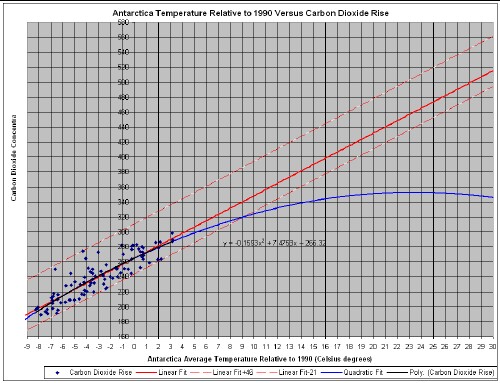
The linear extraplation with an error band indicates an eventual Antarctica temperature of over 20o Celsius above 1990 temperature for 400 ppmv CO2 concentration. (The quadratic extrapolation yields runaway temperatures.) There is a time lag of a few hundred to thousands of years between changes of one of these two mutually positive-feedback variables and changes in the other, so the word "eventual" is used.
This is a very crude way to "predict" future temperature. Below will be shown a better way that takes account of the dust concentration in the atmosphere, which has a cooling effect called Global Dimming.
Dust and other aerosols in the atmosphere shade the earth; they cause cooling of the Earth. The rise in temperature of the Earth due to Global Warming was halted by Global Dimming due to aerosols put into the atmosphere by burning dirtier coal from about 1880 to about 1920. Then the rapid increase in burning oil reinstituted Global Warming until about 1940 when the huge amount of aerosols put into the atmosphere by burning high-sulfur oil along with dirtier coal, again halted Global Warming with Global Dimming. Then the clean-air legislation of the United Kingdom and the United States cut back Global Dimming, so that Global Warming then became predominant again. The following graph shows those two periods of Global Dimming:

The correlation can be clearly seen between declining temperature in the graph above and sulfur dioxide put into the atmosphere in the graph below:
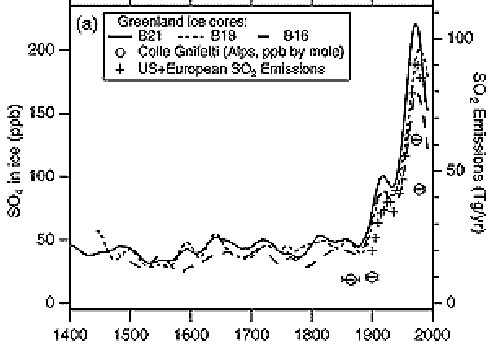
Note in the temperature graph above the leveling of the average global temperature over the last several years. This is probably due to global dimming due to extreme amounts of aerosols put into the atmosphere by developing counties such as China and India.
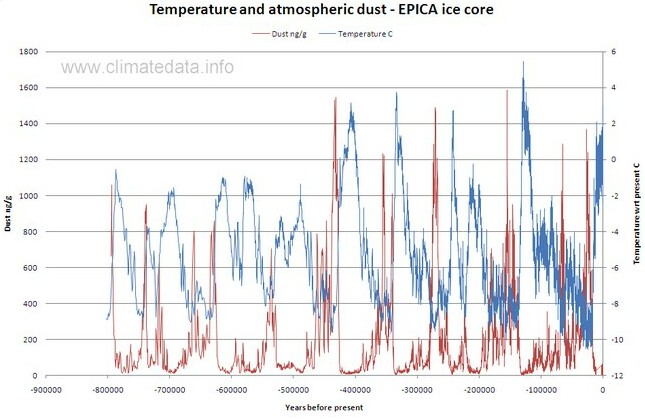
Dust concentration data in the atmosphere have been measured in ice cores at Vostok, Antarctica:
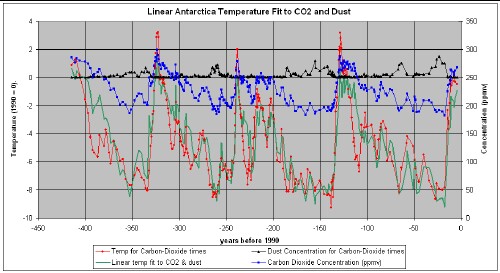
A linear fit of the temperature to the CO2 and the dust concentrations yields the fit shown in the graph above. The formula for the fit is
T = -25.07 + 0.0902 x CO2 + -0.5487 x Dust .
It appears that the cool effect of dust (ppmv) is about 6 times the heating effect of CO2 (ppmv).
Sulfur dioxide, carbon soot and other pollutants that humans have inserted into the atmosphere probably have a similar effect as dust. The atmospheric cooling affect of these aerosols is known as Global Dimming.
In recent decades governments have enacted controls to reduce aerosols put into the atmosphere by human activity. Thus, the moderation of Global Warming by those aerosols has been reduced.
As an interesting exercise consider the unachievable case where all aerosols have been eliminated from the atmosphere. Using the formula given above with the dust concentration set to zero yields the following temperature for the two cases of eventual CO2 concentration of 450 ppmv and 500 ppmv by the year 2100:
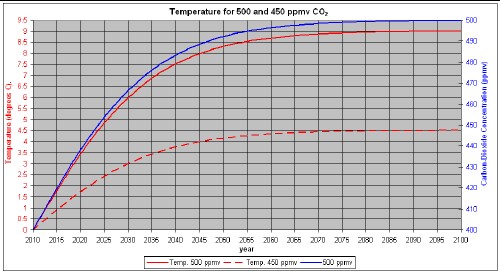
This is a crude analysis because other variables also effect atmospheric temperature; e.g., methane concentration in the atmosphere.
If this crude analysis has any truth in it, the temperatures indicated are disastrous for the human future.
The question that must be asked is "What controls should be put on CO2 emissions to keep the CO2 concentration in the atmosphere below certain levels."
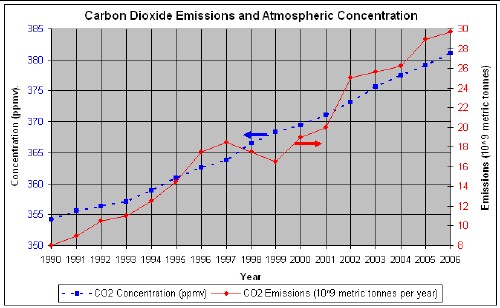
The following is a plot of emissions data and concentration data for the world for recent years:
A plot of emissions versus concentration yields a reasonable linear fit:
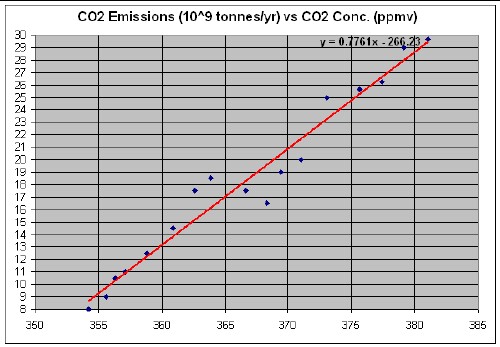
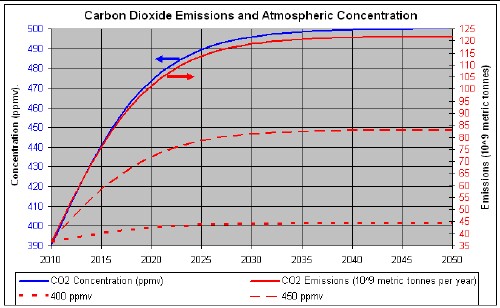
If governments wish to limit CO2 concentration in the atmosphere to 450 or 500 ppmv, the following plot shows the total emissions limits:
Homo sapiens evolved with a considerable amount of dust in the atmosphere, especially during the cold part, about 90% of the time, of the last two 115,000-years-duration ice ages. Completely clear air may not be the most advantageous for Homo sapiens survival. However, science has made it very clear that the aerosol pollutants (sulfur dioxide, carbon soot, etc.) that humans have put into the atmosphere are dangerous to human survival. Anyway, there will be dust in the air, which will have a cooling Global Dimming effect to conteract some of Global Warming.
It is well known that Global Dimming due to aerosol pollution has been a large factor in the lack of rain over Africa, causing many deaths there. As a result much dust is being stirred up there and is blowing out over the North Atlantic causing cooling of the North Atlantic. Thus, there may be less hurricanes in the North Atlantic. However, the Gulf of Mexico is not much effected by that dust. Therefore, it is extremely warm because of Global Warming during hurricane season; so, hurricane that make it into the Gulf are likely to become extremely powerful.
The agenda for governments must be to reduce both aerosol pollutants and CO2 concentration in the atmosphere on an emergency schedule.
The emissions limits given above may be high because dust was not considered in calculating them.