L. David Roper
http://www.roperld.com/personal/roperldavid.htm
6 April, 2016
Glaciers-mass-loss data are conveniently display in two graphs here and here. The data are given in meters water equivalent (1 meter w.e. ~ 1.1 meters ice).
I calculated mass loss versus time for two glacier thicknesses: 1 km w.e. and 100 meters w.e. in about year 1960.
In this work I fitted a hyperbolic tangent function to the Glaciers-ice-mass-loss data and projected the fits into the future.
The equation for the fit is the hyperbolic tangent function:
![]() .
.
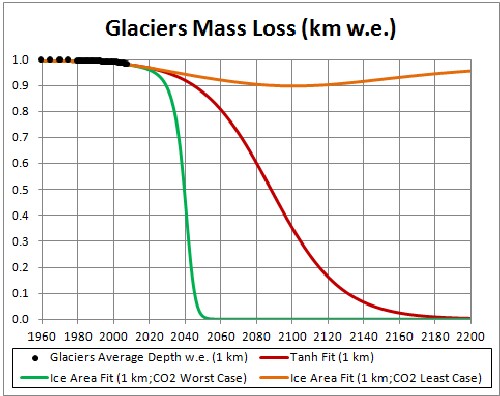
The fit for 1-km-w.e. glaciers is shown in the following graph:
|
The glacier disappears at about 2170. |
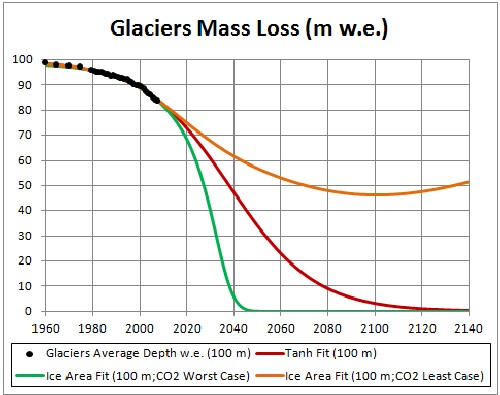
The fit for 100-m-w.e. glaciers is shown in the following graph:
|
The glacier disappears at about 2120. |
No account has been allow here for the fact that atmospheric carbon will decrease after fossil-fuels extraction peaks at about 2025.
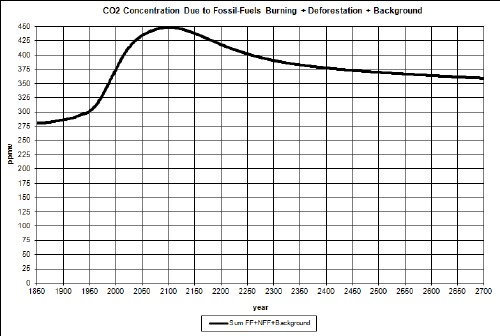
In another study I have projected atmospheric-carbon-dioxide concentration (CD) into the future, one a least-case (LC) projection and another a worst-case (WC) projection. For LC the CD peaks at about 470 ppmv at about year 2115; for WC the CD peaks at about 1110 ppmv at about year 2135. The peaks are due to the fact that fossil-fuels have extraction peaks due to depletion of the resources.
Here are graphs of the two cases:
 |
 |
Here I report on fits of the Arctic-sea-ice area to the two CD cases using the hyperbolic-tangent function
![]() ,
,
where CD = atmospheric-carbon-dioxide concentration.
The reason for using the hyperbolic tanget is because the amount of ice must asymptotically approach some value greater than or equal to zero.
The three fits for the two cases are shown in the following graphs:
 |
 |
Both CD fits eventually rise after going toward or near zero, because the fossil-fuels extraction (and, thus, use) falls to zero after peaking. The LC one rises faster because its carbon-dioxide concentration is lower.
For those interested in glaciers in Nepal, India and China, see: http://assets.panda.org/downloads/himalayaglaciersreport2005.pdf . Their average thickness appears to be less than 100 meters, so they possibly disappear faster than the 100-meters-thick-glaciers calculation given above. Because of their high elevation one might think that their temperatures will be lower than other glaciers, so they would not melt as fast as the others. However, the temperatures at high elevations will increase faster than temperatures at lower elevations as global warming increases.
The data indicate that complete disappearance of a glacier with 1-kilometer thickness will occur at about year 2170; for a 100-m thick glacier it will be about year 2120.
However, the hyperbolic-tangent fits to atmospheric-carbon-dioxide-concentration (CD) fits give quite different results:
Global Ice Mass Loss
Roper Global-Heating Web Pages
L. David Roper interdisciplinary studies