L. David Roper
http://www.roperld.com/personal/roperldavid.htm
4 April, 2016
The best reference I have found for recent data of carbon-dioxide emissions for different countries is http://en.wikipedia.org/wiki/List_of_countries_by_carbon_dioxide_emissions. The data for the countries with the highest emissions for 2012, the latest year for which data are available, are:
Country |
CO2 emissions |
% of emissions |
per capita emissions |
Times World |
Times-World x % |
| World | 34,500,000 | 4.9 | |||
| China | 9,860,000 | 28.58% | 7.1 | 1.45 | 41.41% |
| United States | 5,190,000 | 15.04% | 16.4 | 3.35 | 50.35% |
| India | 1,970,000 | 5.71% | 1.6 | 0.33 | 1.86% |
| Russia | 1,770,000 | 5.13% | 12.4 | 2.53 | 12.98% |
| Japan | 1,320,000 | 3.83% | 10.4 | 2.12 | 8.12% |
| Germany | 810,000 | 2.35% | 9.7 | 1.98 | 4.65% |
| South Korea | 640,000 | 1.86% | 13 | 2.65 | 4.92% |
| Canada | 560,000 | 1.62% | 16 | 3.27 | 5.30% |
| United Kingdom | 490,000 | 1.42% | 7.7 | 1.57 | 2.23% |
There are two important country values to notice: the total emissions and the emissions per capita for a country. I include both of these in an index I call Times-World x % Emissions (TW%E), which is the product of the % of emissions and the ratio of the per-capita emissions for a country over the world per-capita emissions. The last column of the table gives that index. The table below orders the 10 countries according to that index:
Country |
CO2 emissions |
% of emissions |
per capita emissions |
Times World |
Times-World x % |
| World | 34,500,000 | 4.9 | |||
| United States | 5,190,000 | 15.04% | 16.4 | 3.35 | 50.35% |
| China | 9,860,000 | 28.58% | 7.1 | 1.45 | 41.41% |
| Russia | 1,770,000 | 5.13% | 12.4 | 2.53 | 12.98% |
| Japan | 1,320,000 | 3.83% | 10.4 | 2.12 | 8.12% |
| Canada | 560,000 | 1.62% | 16 | 3.27 | 5.30% |
| South Korea | 640,000 | 1.86% | 13 | 2.65 | 4.92% |
| Germany | 810,000 | 2.35% | 9.7 | 1.98 | 4.65% |
| United Kingdom | 490,000 | 1.42% | 7.7 | 1.57 | 2.23% |
| India | 1,970,000 | 5.71% | 1.6 | 0.33 | 1.86% |
I believe that this TW%E index gives a reasonable view of the responsibility of countries for emission of carbon dioxide into the atmosphere. The U.S. and China have by far the largest responsibility for carbon-dioxide emissions.
It is important to note that much of the carbon-dioxide emissions of China is due to production of goods to sell in the U.S.
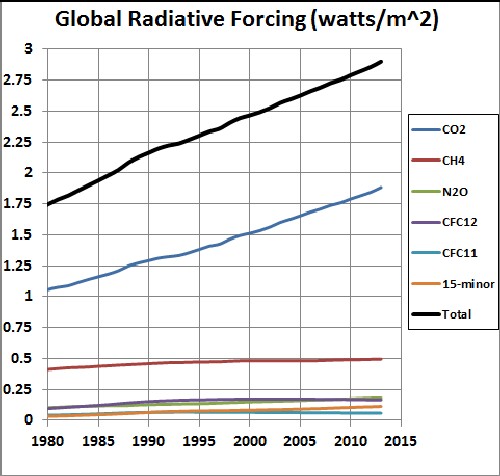
Of course, there are other greenhouse gases, the most important of which is the truly dangerous methane. However, as the following graph shows global-warming radiative forcing due to methane in the atmosphere is much smaller than for carbon dioxide:
Using a similar type of index for methane emissions as was used for carbon-dioxide emissions above:
Country Name |
Methane emissions in kilotonnes CO2 equivalent |
Population |
% emissions |
per capita x 1000 |
Times World |
Times-World x % |
| World | 7,515,150.3 | 7,263,838,600 | 1.03 | |||
| China | 1,642,257.6 | 1,366,990,000 | 21.85% | 1.20 | 1.16 | 25.38% |
| Russia | 533,546.0 | 146,149,200 | 7.10% | 3.65 | 3.53 | 25.05% |
| Brazil | 443,288.9 | 203,212,000 | 5.90% | 2.18 | 2.11 | 12.44% |
| United States | 524,688.1 | 318,816,000 | 6.98% | 1.65 | 1.59 | 11.11% |
| Australia | 122,548.9 | 23,612,700 | 1.63% | 5.19 | 5.02 | 8.18% |
| Canada | 104,499.8 | 35,540,419 | 1.39% | 2.94 | 2.84 | 3.95% |
| India | 621,479.7 | 1,260,160,000 | 8.27% | 0.49 | 0.48 | 3.94% |
| Indonesia | 218,929.1 | 252,164,800 | 2.91% | 0.87 | 0.84 | 2.44% |
| Iran | 115,333.9 | 77,775,100 | 1.53% | 1.48 | 1.43 | 2.20% |
| Thailand | 104,410.5 | 64,871,000 | 1.39% | 1.61 | 1.56 | 2.16% |
| Vietnam | 111,337.5 | 89,708,900 | 1.48% | 1.24 | 1.20 | 1.78% |
| Pakistan | 155,236.3 | 188,020,000 | 2.07% | 0.83 | 0.80 | 1.65% |
| Mexico | 115,858.0 | 119,713,203 | 1.54% | 0.97 | 0.94 | 1.44% |
| Bangladesh | 103,079.7 | 157,047,000 | 1.37% | 0.66 | 0.63 | 0.87% |
China and Russia have the largest responsibility for methane emissions, followed by Brazil and the U.S..
Many think that the most important number is the amount of greenhouse gases that are currently in the atmosphere. China is not even in the ball park of this number compared to the U.S. We owe a great debt to the rest of the world to atone for our profligate past behavior of dumping carbon into the atmosphere!