(Back to
Politics)
(Back to United States Health and
Political Parties)
(Go to data table at
bottom.)
The cancer-death rate (number/1000) varies greatly among the states in the United States. (See table at end for 1996 rates.)
An interesting question to ask is: Is there any correlation between the cancer-death rate and the strength of the two political parties in the states?
I compared different state's cancer-death rate (CDR) data for 1996 with the results of the 1996 presidential election for each state. (See table at end for votes in the 1996 election.) A correlation calculation yielded the following:
| Correlation | Rate |
| Democrat vote | +0.319 |
| Republican vote | -0.223 |
That is, the Democratic votes for the states had a 32% positive correlation with increasing CDR and the Republican votes had a 22% negative correlation. States with high cancer-death rate vote more Democratic than Republican and vice versa.
|
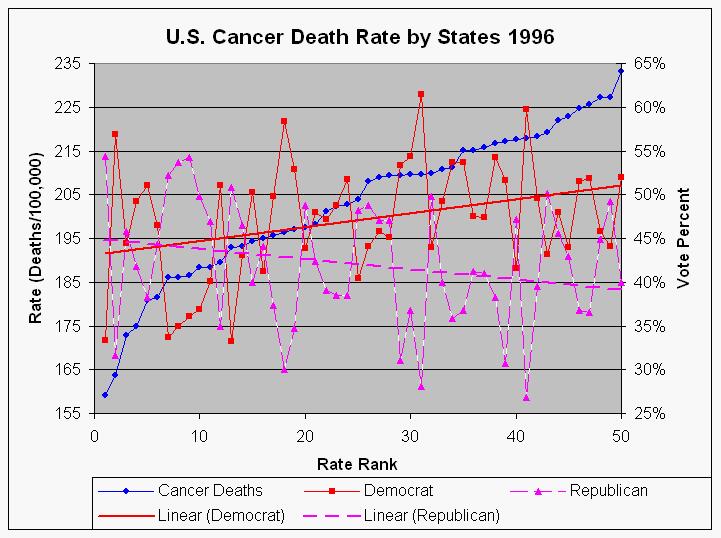
| This is a plot of the cancer-death rate (CDR) sorted by rank of the states compared to the Democratic votes and the Republican votes. (See table at end for the data.) Also shown are linear fits to the two votes. This shows visually the positive correlation of CDR with the Democratic vote and the negative correlation with the Republican vote. Note the large difference between the highest state (Louisiana with 233) and the lowest state (Utah with 159). |
What can one conclude from these results? Whatever factors cause the large disparity for cancer-death rates between the various states also cause those states to tend to vote Democratic.
My Republican native state, Oklahoma (rate=204), ranked 25 of 50 and my Republican adopted state, Virginia (rate=209), ranked 28 of 50 for increasing cancer-death rate in 1996.
| U.S. cancer deaths | 1996 election | |||
| State | Cancer Deaths (age adj./100000) |
Democrat | Republican | Rank |
| Utah | 159 | 33.3% | 54.4% | 1 |
| Hawaii | 164 | 56.9% | 31.6% | 2 |
| Colorado | 173 | 44.4% | 45.8% | 3 |
| New Mexico | 174.9 | 49.2% | 41.9% | 4 |
| California | 181 | 51.1% | 38.2% | 5 |
| Arizona | 181 | 46.5% | 44.3% | 6 |
| Idaho | 186 | 33.6% | 52.2% | 7 |
| Nebraska | 186 | 35.0% | 53.7% | 8 |
| Kansas | 187 | 36.1% | 54.3% | 9 |
| Wyoming | 188 | 36.8% | 49.8% | 10 |
| North Dakota | 188 | 40.1% | 46.9% | 11 |
| Minnesota | 190 | 51.1% | 35.0% | 12 |
| Alaska | 193 | 33.3% | 50.8% | 13 |
| South Dakota | 193 | 43.0% | 46.5% | 14 |
| Iowa | 194 | 50.3% | 39.9% | 15 |
| Montana | 195 | 41.3% | 44.1% | 16 |
| Washington | 196 | 49.8% | 37.3% | 17 |
| New York | 196 | 58.3% | 30.0% | 18 |
| Connecticut | 197 | 52.8% | 34.7% | 19 |
| Texas | 198 | 43.8% | 48.8% | 20 |
| Florida | 198 | 48.0% | 42.3% | 21 |
| Oregon | 201 | 47.2% | 39.1% | 22 |
| Wisconsin | 202 | 48.8% | 38.5% | 23 |
| Michigan | 203 | 51.7% | 38.5% | 24 |
| Oklahoma | 204 | 40.4% | 48.3% | 25 |
| North Carolina | 208 | 44.0% | 48.7% | 26 |
| Georgia | 209 | 45.8% | 47.0% | 27 |
| Virginia | 209 | 45.1% | 47.1% | 28 |
| Vermont | 210 | 53.4% | 31.1% | 29 |
| Illinois | 210 | 54.3% | 36.8% | 30 |
| Massachusetts | 210 | 61.5% | 28.1% | 31 |
| South Carolina | 210 | 44.0% | 49.8% | 32 |
| Pennsylvania | 211 | 49.2% | 40.0% | 33 |
| New Jersey | 211 | 53.7% | 35.9% | 34 |
| Arkansas | 215 | 53.7% | 36.8% | 35 |
| Missouri | 215 | 47.5% | 41.2% | 36 |
| Ohio | 216 | 47.4% | 41.0% | 37 |
| Maryland | 217 | 54.3% | 38.3% | 38 |
| Maine | 217 | 51.6% | 30.8% | 39 |
| Indiana | 218 | 41.6% | 47.1% | 40 |
| Rhode Island | 218 | 59.7% | 26.8% | 41 |
| New Hampshire | 218 | 49.6% | 39.6% | 42 |
| Alabama | 219 | 43.2% | 50.1% | 43 |
| Tennessee | 222 | 48.0% | 45.6% | 44 |
| Nevada | 223 | 43.9% | 42.9% | 45 |
| West Virginia | 225 | 51.5% | 36.8% | 46 |
| Delaware | 226 | 51.8% | 36.6% | 47 |
| Kentucky | 227 | 45.8% | 44.9% | 48 |
| Mississippi | 227 | 44.1% | 49.2% | 49 |
| Louisiana | 233 | 52.0% | 39.9% | 50 |
(Back to top of data
table)
(Back to the top of this page)
(Back to United States Health and Political
Parties)
(Back to Politics)