Wages and Political Parties
(Back to
Politics)
(Back to Economy and Political
Parties)
(Go to data table at bottom.)
Hourly Wages:
The U. S. hourly earnings in private industry for1964-2000 are available
at http://stats.bls.gov/top20.html#OCWC , whose values are shown in the
table at the bottom of this page.
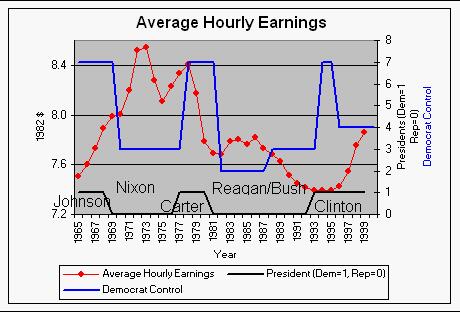 |
This shows the U.S. average hourly earnings in constant 1982
dollars for the years 1964-2000 plotted with the presidential administrations
and the Democrat control index. Note the precipitous
declines during the Republican administrations of Nixon and Reagan/Bush and the
Democratic Carter administration. |
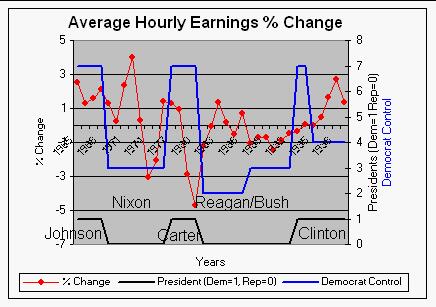 |
This shows the % change in the U.S. average hourly earnings in
constant 1982 dollars for the years 1964-2000 plotted with the presidential
administrations and the Democrat control index. Note the
precipitous declines during the Republican administrations of Nixon and
Reagan/Bush and the Democratic Carter administration. |
The following table shows the correlation coefficients for the average
hourly earnings and various measures of Democratic Party control. Note the
positive correlations for Senate control and presidential control.
| Correlation
coefficients: |
| Average Hourly
Earnings: |
% Change |
| Senate Dem/Rep |
0.13 |
| House Dem/Rep |
-0.12 |
| President (Dem=1, Rep=0) |
0.16 |
| Democrat Control |
0.04 |
Minimum Wages:
The U. S. minimum wage for the years 1960-1997 are available at
http://epinet.org/datazone/data/minimumwage.xls, whose values are shown
in the table at the bottom of this page..
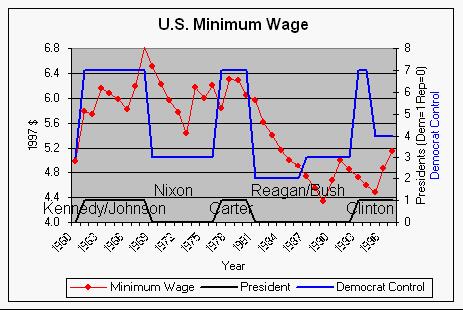 |
This shows the U.S. minimum wage in constant 1997 dollars for the
years 1960-1997 plotted with the presidential administrations and the
Democrat control index.. Note the precipitous declines
during the Republican administrations of Nixon and Reagan/Bush. |
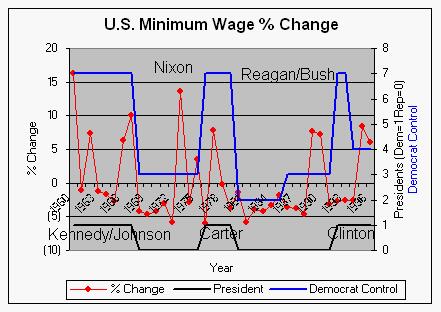 |
This shows the U.S. minimum wage in constant 1997 dollars for the
years 1960-1997 plotted with the Democrat control index.
Note the precipitous declines during the Republican administrations of Nixon
and Reagan/Bush. |
The following table shows the correlation coefficients for the minimum
wage and various measures of Democratic Party control. Note the sizeable
positive correlation for all measures except House control.
| Correlation
coefficients: |
| Minimum Wage: |
% Change |
| Senate Dem/Rep |
0.24 |
| House Dem/Rep |
-0.14 |
| President (Dem=1, Rep=0) |
0.31 |
| Democrat Control |
0.28 |
Presidential Administrations and Democratic Control:
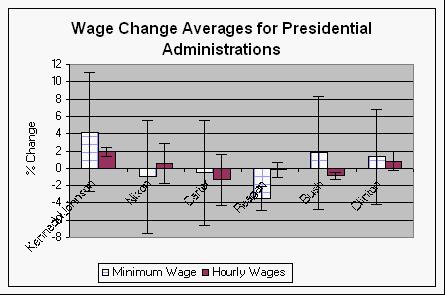 |
This shows the average % change in the U.S.minimum wage and the
average hourly earnings for the presidential administrations. |
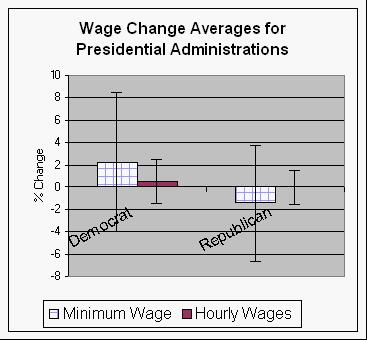 |
This shows the average % change in the U.S.minimum wage and the
average hourly earnings for the political parties of the presidential
administrations. Notice in the graph above that the Reagan administrations made
a huge negative contribution to the Republican administrations. |
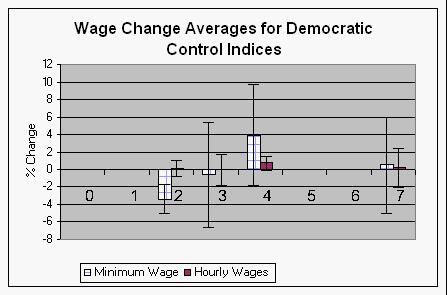 |
This shows the average % change in the U.S.minimum wage and the
average hourly earnings for the Democratic control indices
for years 1964-1997. Note that the highest positive value for both is when the
president is Democratic and the congress is Republican. |
Democratic Control Index:
The Democratic Control Index is defined as
- 7=Democratic party has presidency and majorities in both the
Senate and House.
- 6=Democratic party has presidency and majority in the
House.
- 5=Democratic party has presidency and majority in the
Senate.
- 4=Democratic party has presidency only.
- 3=Democratic party has majority in the House and Senate, but
not the presidency.
- 2=Democratic party has majority in the House only and not the
presidency.
- 1=Democratic party has majority in the Senate only and not the
presidency.
- 0=Democratic party is in minority in both the Senate and the
House and does not have the presidency.
|
| A diagram showing the
Democratic Party Control Index: |
| Democratic Control |
Democratic Party Control
Index |
Republican Control |
| nothing |
0 |
President, House & Senate |
| Senate |
1 |
President & House |
| House |
2 |
President & Senate |
| House & Senate |
3 |
President |
| President |
4 |
House & Senate |
| President & Senate |
5 |
House |
| President & House |
6 |
Senate |
| President, House & Senate |
7 |
nothing |
(Back to the top of
Wages and Political Parties)
(Back to Economy and
Political Parties)
(Back to
Politics)
Data Tables:
U. S. average Hourly Earnings in Private Industry
(1982 $) for 1964-2000 are available at
http://stats.bls.gov/top20.html#OCWC .
| Year |
Jan |
Feb |
Mar |
Apr |
May |
Jun |
Jul |
Aug |
Sep |
Oct |
Nov |
Dec |
Average Hourly Earnings |
| 1964 |
7.23 |
7.26 |
7.26 |
7.29 |
7.3 |
7.3 |
7.33 |
7.39 |
7.37 |
7.34 |
7.38 |
7.41 |
7.32 |
| 1965 |
7.38 |
7.45 |
7.48 |
7.45 |
7.49 |
7.47 |
7.5 |
7.55 |
7.53 |
7.59 |
7.6 |
7.58 |
7.51 |
| 1966 |
7.58 |
7.57 |
7.57 |
7.58 |
7.61 |
7.62 |
7.65 |
7.58 |
7.62 |
7.62 |
7.63 |
7.63 |
7.61 |
| 1967 |
7.69 |
7.67 |
7.7 |
7.7 |
7.7 |
7.72 |
7.75 |
7.76 |
7.74 |
7.74 |
7.78 |
7.78 |
7.73 |
| 1968 |
7.8 |
7.8 |
7.84 |
7.87 |
7.88 |
7.89 |
7.89 |
7.91 |
7.94 |
7.92 |
7.96 |
7.97 |
7.89 |
| 1969 |
7.97 |
7.98 |
7.95 |
7.96 |
7.99 |
8 |
7.98 |
8.02 |
8 |
8.01 |
8.02 |
8.01 |
7.99 |
| 1970 |
7.99 |
8 |
8.01 |
7.97 |
8 |
8.01 |
8.02 |
8.05 |
8.03 |
8 |
8 |
8.01 |
8.01 |
| 1971 |
8.07 |
8.1 |
8.17 |
8.15 |
8.21 |
8.19 |
8.18 |
8.23 |
8.23 |
8.25 |
8.26 |
8.29 |
8.19 |
| 1972 |
8.43 |
8.41 |
8.47 |
8.51 |
8.52 |
8.5 |
8.5 |
8.55 |
8.56 |
8.59 |
8.59 |
8.62 |
8.52 |
| 1973 |
8.63 |
8.61 |
8.58 |
8.59 |
8.55 |
8.56 |
8.63 |
8.46 |
8.51 |
8.48 |
8.47 |
8.46 |
8.54 |
| 1974 |
8.39 |
8.35 |
8.31 |
8.29 |
8.31 |
8.35 |
8.3 |
8.28 |
8.25 |
8.24 |
8.15 |
8.16 |
8.28 |
| 1975 |
8.12 |
8.11 |
8.12 |
8.11 |
8.13 |
8.13 |
8.09 |
8.13 |
8.11 |
8.09 |
8.12 |
8.09 |
8.11 |
| 1976 |
8.1 |
8.16 |
8.18 |
8.18 |
8.22 |
8.23 |
8.24 |
8.27 |
8.26 |
8.27 |
8.31 |
8.32 |
8.23 |
| 1977 |
8.3 |
8.29 |
8.3 |
8.31 |
8.32 |
8.31 |
8.34 |
8.33 |
8.35 |
8.39 |
8.38 |
8.37 |
8.33 |
| 1978 |
8.42 |
8.42 |
8.42 |
8.45 |
8.42 |
8.41 |
8.41 |
8.4 |
8.42 |
8.39 |
8.39 |
8.38 |
8.41 |
| 1979 |
8.38 |
8.36 |
8.32 |
8.22 |
8.21 |
8.17 |
8.14 |
8.11 |
8.1 |
8.04 |
8.01 |
7.99 |
8.17 |
| 1980 |
7.9 |
7.88 |
7.82 |
7.79 |
7.75 |
7.74 |
7.76 |
7.77 |
7.76 |
7.76 |
7.75 |
7.73 |
7.78 |
| 1981 |
7.72 |
7.71 |
7.74 |
7.72 |
7.71 |
7.7 |
7.65 |
7.67 |
7.66 |
7.65 |
7.67 |
7.65 |
7.69 |
| 1982 |
7.69 |
7.69 |
7.72 |
7.72 |
7.71 |
7.64 |
7.64 |
7.66 |
7.66 |
7.65 |
7.68 |
7.74 |
7.68 |
| 1983 |
7.78 |
7.81 |
7.8 |
7.77 |
7.78 |
7.78 |
7.79 |
7.72 |
7.79 |
7.81 |
7.8 |
7.81 |
7.79 |
| 1984 |
7.81 |
7.8 |
7.82 |
7.85 |
7.82 |
7.84 |
7.83 |
7.77 |
7.77 |
7.75 |
7.78 |
7.79 |
7.80 |
| 1985 |
7.77 |
7.76 |
7.76 |
7.76 |
7.75 |
7.77 |
7.76 |
7.77 |
7.8 |
7.76 |
7.74 |
7.76 |
7.76 |
| 1986 |
7.71 |
7.76 |
7.82 |
7.85 |
7.85 |
7.83 |
7.83 |
7.84 |
7.81 |
7.83 |
7.85 |
7.83 |
7.82 |
| 1987 |
7.8 |
7.78 |
7.77 |
7.74 |
7.75 |
7.72 |
7.7 |
7.72 |
7.7 |
7.7 |
7.72 |
7.72 |
7.74 |
| 1988 |
7.72 |
7.7 |
7.69 |
7.7 |
7.71 |
7.69 |
7.67 |
7.65 |
7.66 |
7.67 |
7.65 |
7.67 |
7.68 |
| 1989 |
7.67 |
7.68 |
7.65 |
7.62 |
7.59 |
7.59 |
7.6 |
7.62 |
7.63 |
7.62 |
7.62 |
7.63 |
7.63 |
| 1990 |
7.56 |
7.57 |
7.56 |
7.56 |
7.58 |
7.57 |
7.55 |
7.49 |
7.46 |
7.43 |
7.43 |
7.43 |
7.52 |
| 1991 |
7.43 |
7.43 |
7.44 |
7.46 |
7.46 |
7.46 |
7.47 |
7.47 |
7.46 |
7.45 |
7.44 |
7.44 |
7.45 |
| 1992 |
7.43 |
7.43 |
7.43 |
7.43 |
7.42 |
7.42 |
7.42 |
7.42 |
7.4 |
7.4 |
7.39 |
7.39 |
7.42 |
| 1993 |
7.39 |
7.38 |
7.41 |
7.39 |
7.38 |
7.39 |
7.39 |
7.39 |
7.4 |
7.38 |
7.39 |
7.39 |
7.39 |
| 1994 |
7.41 |
7.42 |
7.4 |
7.41 |
7.41 |
7.39 |
7.38 |
7.37 |
7.37 |
7.39 |
7.38 |
7.39 |
7.39 |
| 1995 |
7.38 |
7.38 |
7.38 |
7.37 |
7.37 |
7.38 |
7.4 |
7.4 |
7.41 |
7.41 |
7.42 |
7.42 |
7.39 |
| 1996 |
7.42 |
7.4 |
7.4 |
7.4 |
7.4 |
7.43 |
7.43 |
7.45 |
7.44 |
7.44 |
7.45 |
7.46 |
7.43 |
| 1997 |
7.47 |
7.47 |
7.49 |
7.5 |
7.53 |
7.54 |
7.55 |
7.57 |
7.58 |
7.6 |
7.63 |
7.65 |
7.55 |
| 1998 |
7.66 |
7.69 |
7.71 |
7.73 |
7.74 |
7.75 |
7.76 |
7.78 |
7.79 |
7.8 |
7.81 |
7.82 |
7.75 |
| 1999 |
7.83 |
7.84 |
7.86 |
7.83 |
7.86 |
7.88 |
7.88 |
7.87 |
7.86 |
7.87 |
7.87 |
7.87 |
7.86 |
| 2000 |
7.88 |
7.87 |
7.83 |
7.87 |
7.87 |
7.85 |
7.86 |
7.9 |
7.87 |
7.89(p) |
7.91(p) |
|
p : preliminary |
(Back to top of data
table)
(Back to the top of Wages and Political
Parties)
(Back to Economy and Political
Parties)
(Back to Politics)
The U. S. minimum wage for the years 1960-1997 are
available at http://epinet.org/datazone/data/minimumwage.xls:
| Minimum Wage |
Current Dollars |
1997 Dollars |
Senate D/R |
House D/R |
President (Dem=1, Rep=0) |
Democrat Control |
Year |
President |
| 1960 |
$1.00 |
$4.99 |
1.88 |
1.85 |
0 |
3 |
1960 |
Eisenhower |
| 1961 |
$1.15 |
$5.80 |
1.78 |
1.50 |
1 |
7 |
1961 |
Kennedy |
| 1962 |
$1.15 |
$5.74 |
1.78 |
1.50 |
1 |
7 |
1962 |
Kennedy/Johnson |
| 1963 |
$1.25 |
$6.16 |
2.03 |
1.47 |
1 |
7 |
1963 |
Johnson |
| 1964 |
$1.25 |
$6.08 |
2.03 |
1.47 |
1 |
7 |
1964 |
Johnson |
| 1965 |
$1.25 |
$5.98 |
2.13 |
2.11 |
1 |
7 |
1965 |
Johnson |
| 1966 |
$1.25 |
$5.82 |
2.13 |
2.11 |
1 |
7 |
1966 |
Johnson |
| 1967 |
$1.40 |
$6.19 |
1.78 |
1.33 |
1 |
7 |
1967 |
Johnson |
| 1968 |
$1.60 |
$6.81 |
1.78 |
1.33 |
1 |
7 |
1968 |
Johnson |
| 1969 |
$1.60 |
$6.52 |
1.38 |
1.27 |
0 |
3 |
1969 |
Nixon |
| 1970 |
$1.60 |
$6.22 |
1.38 |
1.27 |
0 |
3 |
1970 |
Nixon |
| 1971 |
$1.60 |
$5.96 |
1.23 |
1.42 |
0 |
3 |
1971 |
Nixon |
| 1972 |
$1.60 |
$5.78 |
1.23 |
1.42 |
0 |
3 |
1972 |
Nixon |
| 1973 |
$1.60 |
$5.44 |
1.33 |
1.26 |
0 |
3 |
1973 |
Nixon |
| 1974 |
$2.00 |
$6.18 |
1.33 |
1.26 |
0 |
3 |
1974 |
Nixon |
| 1975 |
$2.10 |
$6.00 |
1.65 |
2.02 |
0 |
3 |
1975 |
Nixon |
| 1976 |
$2.30 |
$6.21 |
1.65 |
2.02 |
0 |
3 |
1976 |
Nixon |
| 1977 |
$2.30 |
$5.84 |
1.61 |
2.04 |
1 |
7 |
1977 |
Carter |
| 1978 |
$2.65 |
$6.30 |
1.61 |
2.04 |
1 |
7 |
1978 |
Carter |
| 1979 |
$2.90 |
$6.29 |
1.41 |
1.75 |
1 |
7 |
1979 |
Carter |
| 1980 |
$3.10 |
$6.05 |
1.41 |
1.75 |
1 |
7 |
1980 |
Carter |
| 1981 |
$3.35 |
$5.97 |
0.87 |
1.26 |
0 |
2 |
1981 |
Reagan |
| 1982 |
$3.35 |
$5.62 |
0.87 |
1.26 |
0 |
2 |
1982 |
Reagan |
| 1983 |
$3.35 |
$5.40 |
0.85 |
1.62 |
0 |
2 |
1983 |
Reagan |
| 1984 |
$3.35 |
$5.17 |
0.85 |
1.62 |
0 |
2 |
1984 |
Reagan |
| 1985 |
$3.35 |
$5.00 |
0.89 |
1.39 |
0 |
2 |
1985 |
Reagan |
| 1986 |
$3.35 |
$4.91 |
0.89 |
1.39 |
0 |
2 |
1986 |
Reagan |
| 1987 |
$3.35 |
$4.73 |
1.22 |
1.46 |
0 |
3 |
1987 |
Reagan |
| 1988 |
$3.35 |
$4.55 |
1.22 |
1.46 |
0 |
3 |
1988 |
Reagan |
| 1989 |
$3.35 |
$4.34 |
1.22 |
1.49 |
0 |
3 |
1989 |
Bush |
| 1990 |
$3.80 |
$4.67 |
1.22 |
1.49 |
0 |
3 |
1990 |
Bush |
| 1991 |
$4.25 |
$5.01 |
1.27 |
1.60 |
0 |
3 |
1991 |
Bush |
| 1992 |
$4.25 |
$4.85 |
1.27 |
1.60 |
0 |
3 |
1992 |
Bush |
| 1993 |
$4.25 |
$4.72 |
1.33 |
1.47 |
1 |
7 |
1993 |
Clinton |
| 1994 |
$4.25 |
$4.60 |
1.33 |
1.47 |
1 |
7 |
1994 |
Clinton |
| 1995 |
$4.25 |
$4.48 |
0.92 |
0.89 |
1 |
4 |
1995 |
Clinton |
| 1996 |
$4.75 |
$4.86 |
0.92 |
0.89 |
1 |
4 |
1996 |
Clinton |
| 1997 |
$5.15 |
$5.15 |
0.87 |
0.92 |
1 |
4 |
1997 |
Clinton |
(Back to top of data
table)
(Back to the top of Wages and Political
Parties)
(Back to Economy and Political
Parties)
(Back to Politics)