(Back to
Politics)
(Back to Economy and Political
Parties)
(Go to data table at
bottom.)
|
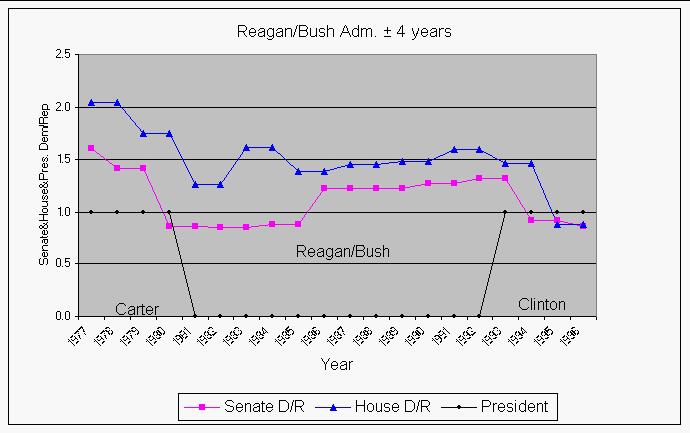
| This shows the political party composition of the U.S. Senate and House of Representatives during the Reagan/Bush administrations and for four years before and after. Note that during the first five years the Republicans controlled the Senate but not the House and during the last seven years the Democrats controlled both houses. |
 |
| This shows the change in % unemployed, % change in federal debt, % change in CPI and % change in GDP during the Reagan/Bush administrations and for four years before and after. Note the increase in change in % unemployed and in % change in federal debt during the first years when the Democrats did not control both sides of Congress and then an increase of both again in the last few years. There were fluctuations in the rate of growth of the GDP. The change in CPI fell rapidly for three years, then fluctuated to the steady value it had during the following Clinton administration. If fact, both GDP change and CPI change leveled out for the duration of the Clinton administration, while unemployment and the change in federal debt decreased. The Carter administration before the Reagan/Bush administration performed well for unemployment and debt increase and not so well on GDP, but better than the Reagan/Bush administrations; its main failure was inflation (change in CPI). |
| Data used in the above graphs (See http://arts.bev.net/roperldavid/politics/economy.htm): | |||||||||||||
| (billions $) | (billion $) | President | |||||||||||
| Year | Debt | % Debt Increase | CPI | % CPI change | GDP | % GDP Change | % Unemployment | Change | Senate Dem/Rep | House Dem/Rep | Dem=1, Rep=0 | Year | |
| 1977 | 718.943 | 10.0 | 60.6 | 6.5 | 2031.4 | 11.38 | 7.05 | -0.65 | 1.61 | 2.04 | 1 | 1977 | Carter |
| 1978 | 789.207 | 9.8 | 65.2 | 7.6 | 2295.9 | 13.02 | 6.07 | -0.98 | 1.41 | 2.04 | 1 | 1978 | Carter |
| 1979 | 845.116 | 7.1 | 72.6 | 11.3 | 2566.4 | 11.78 | 5.85 | -0.22 | 1.41 | 1.75 | 1 | 1979 | Carter |
| 1980 | 930.21 | 10.1 | 82.4 | 13.5 | 2795.6 | 8.93 | 7.18 | 1.33 | 0.87 | 1.75 | 1 | 1980 | Carter |
| 1981 | 1028.729 | 10.6 | 90.9 | 10.3 | 3131.3 | 12.01 | 7.62 | 0.44 | 0.87 | 1.26 | 0 | 1981 | Reagan |
| 1982 | 1197.073 | 16.4 | 96.5 | 6.2 | 3259.2 | 4.08 | 9.71 | 2.09 | 0.85 | 1.26 | 0 | 1982 | Reagan |
| 1983 | 1410.702 | 17.8 | 99.6 | 3.2 | 3534.9 | 8.46 | 9.60 | -0.11 | 0.85 | 1.62 | 0 | 1983 | Reagan |
| 1984 | 1662.966 | 17.9 | 103.9 | 4.3 | 3932.7 | 11.25 | 7.51 | -2.09 | 0.89 | 1.62 | 0 | 1984 | Reagan |
| 1985 | 1945.942 | 17.0 | 107.6 | 3.6 | 4213 | 7.13 | 7.19 | -0.32 | 0.89 | 1.39 | 0 | 1985 | Reagan |
| 1986 | 2125.303 | 9.2 | 109.6 | 1.9 | 4452.9 | 5.69 | 7.00 | -0.19 | 1.22 | 1.39 | 0 | 1986 | Reagan |
| 1987 | 2350.277 | 10.6 | 113.6 | 3.6 | 4742.5 | 6.50 | 6.18 | -0.82 | 1.22 | 1.46 | 0 | 1987 | Reagan |
| 1988 | 2602.338 | 10.7 | 118.3 | 4.1 | 5108.3 | 7.71 | 5.49 | -0.68 | 1.22 | 1.46 | 0 | 1988 | Reagan |
| 1989 | 2857.431 | 9.8 | 124 | 4.8 | 5489.1 | 7.45 | 5.26 | -0.23 | 1.22 | 1.49 | 0 | 1989 | Bush |
| 1990 | 3233.313 | 13.2 | 130.7 | 5.4 | 5803.2 | 5.72 | 5.62 | 0.36 | 1.27 | 1.49 | 0 | 1990 | Bush |
| 1991 | 3665.303 | 13.4 | 136.2 | 4.2 | 5986.2 | 3.15 | 6.85 | 1.23 | 1.27 | 1.60 | 0 | 1991 | Bush |
| 1992 | 4064.621 | 10.9 | 140.3 | 3 | 6318.9 | 5.56 | 7.49 | 0.64 | 1.33 | 1.60 | 0 | 1992 | Bush |
| 1993 | 4411.489 | 8.5 | 144.5 | 3 | 6642.3 | 5.12 | 6.91 | -0.58 | 1.33 | 1.47 | 1 | 1993 | Clinton |
| 1994 | 4692.75 | 6.4 | 148.2 | 2.6 | 7054.3 | 6.20 | 6.10 | -0.81 | 0.92 | 1.47 | 1 | 1994 | Clinton |
| 1995 | 4973.983 | 6.0 | 152.4 | 2.8 | 7400.5 | 4.91 | 5.59 | -0.51 | 0.92 | 0.89 | 1 | 1995 | Clinton |
| 1996 | 5224.811 | 5.0 | 156.9 | 3 | 7813.2 | 5.58 | 5.41 | -0.18 | 0.87 | 0.89 | 1 | 1996 | Clinton |
| Year | Debt | % Debt Increase | CPI | % CPI change | GDP | % GDP Change | % Unemployment | Change | Senate D/R | House D/R | Dem./Rep. | Year | |
| (Back
to the top of Reagan/Bush Administration) (Back to top of data table) (Back to Politics) |
|||||||||||||