U.S. Federal Debt and Political
Parties
(Back to
Politics)
(Back to Economy and Political
Parties)
(Go to data tables at
bottom.)
Update to this page.
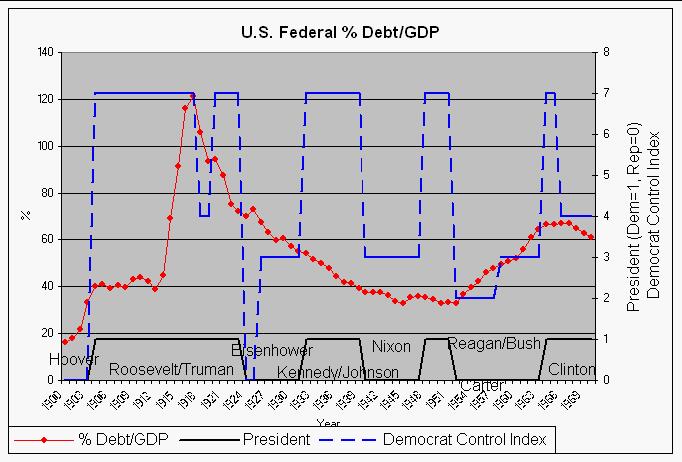 |
| This shows the U.S. Federal % debt/GDP versus time for years
1900-1999 compared to presidential terms (Dem=1, Rep=0) and Democratic control
index of the federal government (see below for
definition). Note the huge unprecedented peace-time rise during the
Reagan/Bush administrations. Undoubtedly this was due to the huge tax cuts and
increases in defense spending without correspondingly reducing federal
expenditures in other areas. Although the federal debt continued to rise during
the Clinton administration at a slower rate than during the Reagan/Bush
administrations, the % debt/GDP decreased. |
 |
| This shows the U.S. Federal Debt versus time for years 71868-1952
compared to presidential terms (Dem=1, Rep=0) and Democratic control index of
the federal government (see below for definition). Note
the large rise during World War II and a smaller rise during War World I. |
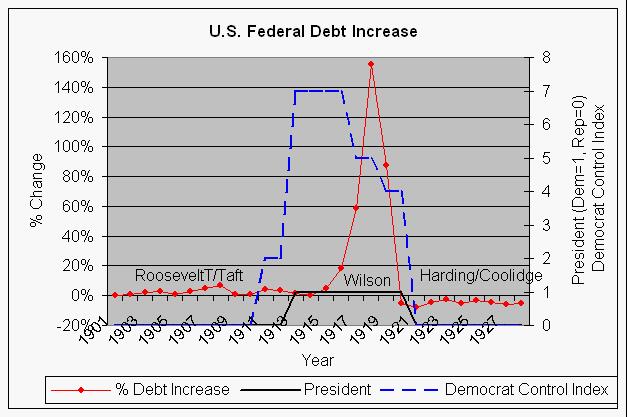 |
| This shows the change in U.S. Federal Debt from year to year for
the years 1901-1928 compared to presidential terms (Dem=1, Rep=0) and
Democratic control index of the federal government (see below
for definition). Of course, the large increase in the change is during WW
I. |
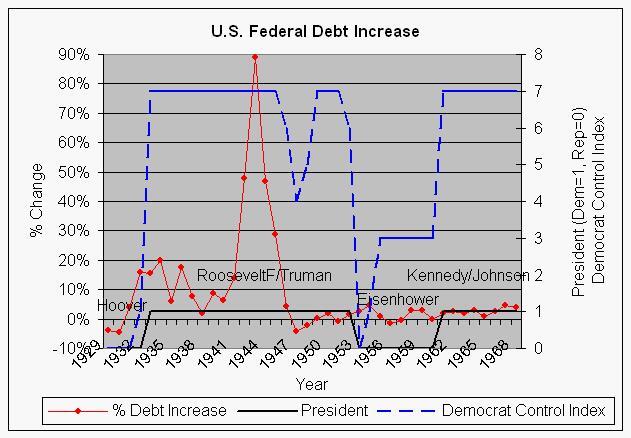 |
| This shows the change in U.S. Federal Debt from year to year for
the years 1929-1968 compared to presidential terms (Dem=1, Rep=0) and
Democratic control index of the federal government (see below
for definition). Of course, the large increase in the change is during WW
II. Increases in the change are also obvious for the Korean and Vietnam
Wars. |
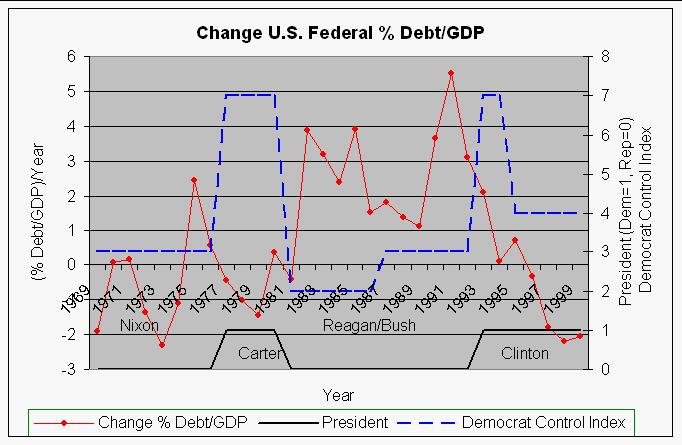 |
| This shows the change in federal % Debt/GDP from year to year for
the years 1969-1999 compared to presidential terms (Dem=1, Rep=0) and
Democratic control index of the federal government (see below
for definition). The huge increases in the change during the Reagan-Bush
administration is unprecented for peace time. Undoubtedly this was due to the
huge tax cuts without correspondingly reducing federal expenditures. It is
clear that Republican administrations have performed very poorly compared to
Democratic administrations in reducing the increase in the federal debt. |
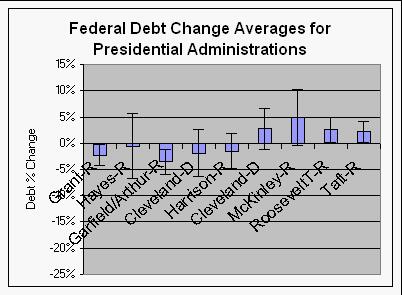 |
This shows the average change in the federal debt for presidential
administrations from Grant to Taft. Standard deviations are shown. Note the
high for the McKinley Republican administration. |
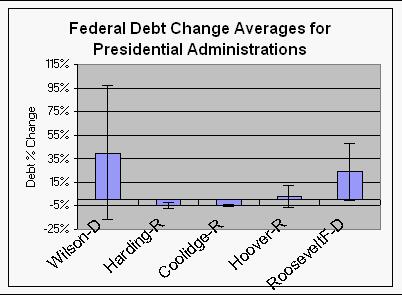 |
This shows the average change in the federal debt for presidential
administrations from Wilson to Franklin Roosevelt. Standard deviations are
shown. Note the highs during World War I (Wilson) and World War II (Roosevelt).
The Wilson |
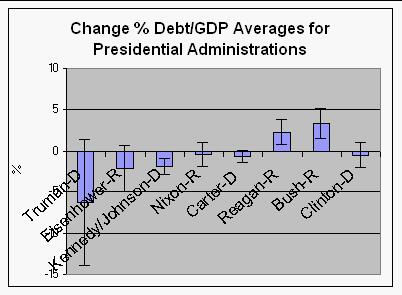 |
This shows the average change in the federal % debt/GDP for
presidential administrations from Truman to Clinton. Standard deviations are
shown. Note the highs for the Reagan and Bush Republican administrations. |
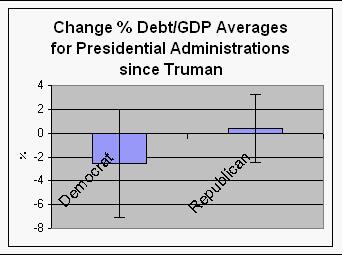 |
This shows the average change in the federal % debt/GDP for
presidential administrations since Truman by political party. Standard
deviations are shown, which are large. |
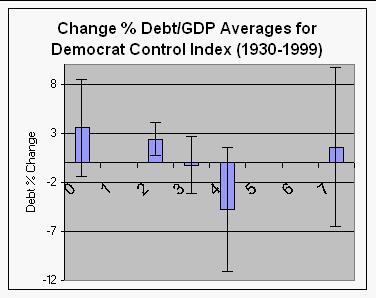 |
This shows the average change in the federal % debt/GDP for
Democrat control index. Standard deviations are shown, which are large. The
lowest is for index 4 (Democratic president and Republican congress) and the
highest is for total Republican control (index 0). |
The correlation coefficients for Democratic control of the Senate, House
and presidency with the % Debt/GDP change for administrations since Franklin
Roosevelts' are:
| Correlations |
% Debt/GDP Change |
| President Dem. |
-0.37 |
| Democratic Control Index |
-0.24 |
Thus, Democratic administrations did much better than Republican
administrations in not increasing the federal debt.
(Back to the top of
National Debt)
(Back to Economy and Political
Parties)
(Back to Politics)
The Democratic Control Index is
defined as
- 7=Democratic party has presidency and majorities in both the
Senate and House.
- 6=Democratic party has presidency and majority in the
House.
- 5=Democratic party has presidency and majority in the
Senate.
- 4=Democratic party has presidency only.
- 3=Democratic party has majority in the House and Senate, but
not the presidency.
- 2=Democratic party has majority in the House only and not the
presidency.
- 1=Democratic party has majority in the Senate only and not the
presidency.
- 0=Democratic party is in minority in both the Senate and the
House and does not have the presidency.
|
| A diagram showing the
Democratic Party Control Index: |
| Democratic Control |
Democratic Party Control
Index |
Republican Control |
| nothing |
0 |
President, House & Senate |
| Senate |
1 |
President & House |
| House |
2 |
President & Senate |
| House & Senate |
3 |
President |
| President |
4 |
House & Senate |
| President & Senate |
5 |
House |
| President & House |
6 |
Senate |
| President, House & Senate |
7 |
nothing |
(Back to the top of
National Debt)
(Back to Economy and Political
Parties)
(Back to Politics)
These data are found at
http://www.mbaonline.com/resources/public-debt/.
| U.S. Federal Debt: |
Senate |
|
|
House |
|
|
President |
|
|
|
| Year |
Debt (billions $) |
% Debt Increase |
Dem. |
Rep. |
Senate D/R |
Dem. |
Rep. |
House D/R |
Dem. |
Rep. |
Year |
|
| 1900 |
2.137 |
|
26 |
53 |
0.49 |
163 |
185 |
0.88 |
0 |
1 |
1900 |
McKinley |
| 1901 |
2.143 |
0.28% |
29 |
56 |
0.52 |
153 |
198 |
0.77 |
0 |
1 |
1901 |
RooseveltT |
| 1902 |
2.159 |
0.75% |
29 |
56 |
0.52 |
153 |
198 |
0.77 |
0 |
1 |
1902 |
RooseveltT |
| 1903 |
2.202 |
1.99% |
32 |
58 |
0.55 |
178 |
207 |
0.86 |
0 |
1 |
1903 |
RooseveltT |
| 1904 |
2.264 |
2.82% |
32 |
58 |
0.55 |
178 |
207 |
0.86 |
0 |
1 |
1904 |
RooseveltT |
| 1905 |
2.275 |
0.49% |
32 |
58 |
0.55 |
136 |
250 |
0.54 |
0 |
1 |
1905 |
RooseveltT |
| 1906 |
2.337 |
2.73% |
32 |
58 |
0.55 |
136 |
250 |
0.54 |
0 |
1 |
1906 |
RooseveltT |
| 1907 |
2.457 |
5.13% |
29 |
61 |
0.48 |
164 |
222 |
0.74 |
0 |
1 |
1907 |
RooseveltT |
| 1908 |
2.627 |
6.92% |
29 |
61 |
0.48 |
164 |
222 |
0.74 |
0 |
1 |
1908 |
RooseveltT |
| 1909 |
2.64 |
0.49% |
32 |
59 |
0.54 |
172 |
219 |
0.79 |
0 |
1 |
1909 |
Taft |
| 1910 |
2.653 |
0.49% |
32 |
59 |
0.54 |
172 |
219 |
0.79 |
0 |
1 |
1910 |
Taft |
| 1911 |
2.766 |
4.26% |
42 |
49 |
0.86 |
228 |
162 |
1.41 |
0 |
1 |
1911 |
Taft |
| 1912 |
2.868 |
3.69% |
42 |
49 |
0.86 |
228 |
162 |
1.41 |
0 |
1 |
1912 |
Taft |
| 1913 |
2.916 |
1.67% |
51 |
44 |
1.16 |
290 |
127 |
2.28 |
1 |
0 |
1913 |
Wilson |
| 1914 |
2.912 |
-0.14% |
51 |
44 |
1.16 |
290 |
127 |
2.28 |
1 |
0 |
1914 |
Wilson |
| 1915 |
3.058 |
5.01% |
56 |
39 |
1.44 |
231 |
193 |
1.20 |
1 |
0 |
1915 |
Wilson |
| 1916 |
3.609 |
18.02% |
56 |
39 |
1.44 |
231 |
193 |
1.20 |
1 |
0 |
1916 |
Wilson |
| 1917 |
5.718 |
58.44% |
53 |
42 |
1.26 |
210 |
216 |
0.97 |
1 |
0 |
1917 |
Wilson |
| 1918 |
14.592 |
155.19% |
53 |
42 |
1.26 |
210 |
216 |
0.97 |
1 |
0 |
1918 |
Wilson |
| 1919 |
27.391 |
87.71% |
47 |
48 |
0.98 |
191 |
237 |
0.81 |
1 |
0 |
1919 |
Wilson |
| 1920 |
25.952 |
-5.25% |
47 |
48 |
0.98 |
191 |
237 |
0.81 |
1 |
0 |
1920 |
Wilson |
| 1921 |
23.977 |
-7.61% |
37 |
59 |
0.63 |
132 |
300 |
0.44 |
0 |
1 |
1921 |
Harding |
| 1922 |
22.963 |
-4.23% |
37 |
59 |
0.63 |
132 |
300 |
0.44 |
0 |
1 |
1922 |
Harding |
| 1923 |
22.35 |
-2.67% |
43 |
51 |
0.84 |
207 |
225 |
0.92 |
0 |
1 |
1923 |
Harding/Coolidge |
| 1924 |
21.251 |
-4.92% |
43 |
51 |
0.84 |
207 |
225 |
0.92 |
0 |
1 |
1924 |
Coolidge |
| 1925 |
20.516 |
-3.46% |
40 |
54 |
0.74 |
183 |
247 |
0.74 |
0 |
1 |
1925 |
Coolidge |
| 1926 |
19.643 |
-4.26% |
40 |
54 |
0.74 |
183 |
247 |
0.74 |
0 |
1 |
1926 |
Coolidge |
| 1927 |
18.512 |
-5.76% |
47 |
48 |
0.98 |
195 |
237 |
0.82 |
0 |
1 |
1927 |
Coolidge |
| 1928 |
17.604 |
-4.90% |
47 |
48 |
0.98 |
195 |
237 |
0.82 |
0 |
0 |
1928 |
Coolidge |
| 1929 |
16.931 |
-3.82% |
39 |
56 |
0.70 |
163 |
267 |
0.61 |
0 |
1 |
1929 |
Hoover |
| 1930 |
16.185 |
-4.41% |
39 |
56 |
0.70 |
163 |
267 |
0.61 |
0 |
1 |
1930 |
Hoover |
| 1931 |
16.801 |
3.81% |
47 |
48 |
0.98 |
216 |
218 |
0.99 |
0 |
1 |
1931 |
Hoover |
| 1932 |
19.487 |
15.99% |
47 |
48 |
0.98 |
216 |
218 |
0.99 |
0 |
1 |
1932 |
Hoover |
| 1933 |
22.539 |
15.66% |
59 |
36 |
1.64 |
313 |
117 |
2.68 |
1 |
0 |
1933 |
RooseveltF |
| 1934 |
27.053 |
20.03% |
59 |
36 |
1.64 |
313 |
117 |
2.68 |
1 |
0 |
1934 |
RooseveltF |
| 1935 |
28.701 |
6.09% |
69 |
25 |
2.76 |
322 |
103 |
3.13 |
1 |
0 |
1935 |
RooseveltF |
| 1936 |
33.779 |
17.69% |
69 |
25 |
2.76 |
322 |
103 |
3.13 |
1 |
0 |
1936 |
RooseveltF |
| 1937 |
36.425 |
7.83% |
75 |
17 |
4.41 |
333 |
89 |
3.74 |
1 |
0 |
1937 |
RooseveltF |
| 1938 |
37.165 |
2.03% |
75 |
17 |
4.41 |
333 |
89 |
3.74 |
1 |
0 |
1938 |
RooseveltF |
| 1939 |
40.44 |
8.81% |
69 |
23 |
3.00 |
262 |
169 |
1.55 |
1 |
0 |
1939 |
RooseveltF |
| 1940 |
42.968 |
6.25% |
69 |
23 |
3.00 |
262 |
169 |
1.55 |
1 |
0 |
1940 |
RooseveltF |
| 1941 |
48.961 |
13.95% |
66 |
28 |
2.36 |
267 |
162 |
1.65 |
1 |
0 |
1941 |
RooseveltF |
| 1942 |
72.422 |
47.92% |
66 |
28 |
2.36 |
267 |
162 |
1.65 |
1 |
0 |
1942 |
RooseveltF |
| 1943 |
136.969 |
89.13% |
57 |
38 |
1.50 |
222 |
209 |
1.06 |
1 |
0 |
1943 |
RooseveltF |
| 1944 |
201.003 |
46.75% |
57 |
38 |
1.50 |
222 |
209 |
1.06 |
1 |
0 |
1944 |
RooseveltF |
| 1945 |
258.682 |
28.70% |
57 |
38 |
1.50 |
243 |
190 |
1.28 |
1 |
0 |
1945 |
RooseveltF/Truman |
| 1946 |
269.422 |
4.15% |
57 |
38 |
1.50 |
243 |
190 |
1.28 |
1 |
0 |
1946 |
Truman |
| 1947 |
258.286 |
-4.13% |
45 |
51 |
0.88 |
188 |
246 |
0.76 |
1 |
0 |
1947 |
Truman |
| 1948 |
252.292 |
-2.32% |
45 |
51 |
0.88 |
188 |
246 |
0.76 |
1 |
0 |
1948 |
Truman |
| 1949 |
252.77 |
0.19% |
54 |
42 |
1.29 |
263 |
171 |
1.54 |
1 |
0 |
1949 |
Truman |
| 1950 |
257.357 |
1.81% |
54 |
42 |
1.29 |
263 |
171 |
1.54 |
1 |
0 |
1950 |
Truman |
| 1951 |
255.222 |
-0.83% |
48 |
47 |
1.02 |
234 |
199 |
1.18 |
1 |
0 |
1951 |
Truman |
| 1952 |
259.105 |
1.52% |
48 |
47 |
1.02 |
234 |
199 |
1.18 |
1 |
0 |
1952 |
Truman |
| 1953 |
266.071 |
2.69% |
46 |
48 |
0.96 |
213 |
221 |
0.96 |
0 |
1 |
1953 |
Eisenhower |
| 1954 |
278.75 |
4.77% |
46 |
48 |
0.96 |
213 |
221 |
0.96 |
0 |
1 |
1954 |
Eisenhower |
| 1955 |
280.769 |
0.72% |
48 |
47 |
1.02 |
232 |
203 |
1.14 |
0 |
1 |
1955 |
Eisenhower |
| 1956 |
276.628 |
-1.47% |
48 |
47 |
1.02 |
232 |
203 |
1.14 |
0 |
1 |
1956 |
Eisenhower |
| 1957 |
274.898 |
-0.63% |
49 |
47 |
1.04 |
234 |
201 |
1.16 |
0 |
1 |
1957 |
Eisenhower |
| 1958 |
282.922 |
2.92% |
49 |
47 |
1.04 |
234 |
201 |
1.16 |
0 |
1 |
1958 |
Eisenhower |
| 1959 |
290.978 |
2.85% |
64 |
34 |
1.88 |
283 |
153 |
1.85 |
0 |
1 |
1959 |
Eisenhower |
| 1960 |
290.217 |
-0.26% |
64 |
34 |
1.88 |
283 |
153 |
1.85 |
0 |
1 |
1960 |
Eisenhower |
| 1961 |
296.169 |
2.05% |
64 |
36 |
1.78 |
262 |
175 |
1.50 |
1 |
0 |
1961 |
Kennedy |
| 1962 |
303.47 |
2.47% |
64 |
36 |
1.78 |
262 |
175 |
1.50 |
1 |
0 |
1962 |
Kennedy/Johnson |
| 1963 |
309.347 |
1.94% |
67 |
33 |
2.03 |
258 |
176 |
1.47 |
1 |
0 |
1963 |
Johnson |
| 1964 |
317.94 |
2.78% |
67 |
33 |
2.03 |
258 |
176 |
1.47 |
1 |
0 |
1964 |
Johnson |
| 1965 |
320.904 |
0.93% |
68 |
32 |
2.13 |
295 |
140 |
2.11 |
1 |
0 |
1965 |
Johnson |
| 1966 |
329.319 |
2.62% |
68 |
32 |
2.13 |
295 |
140 |
2.11 |
1 |
0 |
1966 |
Johnson |
| 1967 |
344.663 |
4.66% |
64 |
36 |
1.78 |
248 |
187 |
1.33 |
1 |
0 |
1967 |
Johnson |
| 1968 |
358.029 |
3.88% |
64 |
36 |
1.78 |
248 |
187 |
1.33 |
1 |
0 |
1968 |
Johnson |
| 1969 |
368.226 |
2.85% |
58 |
42 |
1.38 |
243 |
192 |
1.27 |
0 |
1 |
1969 |
Nixon |
| 1970 |
389.158 |
5.68% |
58 |
42 |
1.38 |
243 |
192 |
1.27 |
0 |
1 |
1970 |
Nixon |
| 1971 |
424.131 |
8.99% |
54 |
44 |
1.23 |
255 |
180 |
1.42 |
0 |
1 |
1971 |
Nixon |
| 1972 |
449.298 |
5.93% |
54 |
44 |
1.23 |
255 |
180 |
1.42 |
0 |
1 |
1972 |
Nixon |
| 1973 |
469.989 |
4.61% |
56 |
42 |
1.33 |
242 |
192 |
1.26 |
0 |
1 |
1973 |
Nixon |
| 1974 |
492.665 |
4.82% |
56 |
42 |
1.33 |
242 |
192 |
1.26 |
0 |
1 |
1974 |
Nixon |
| 1975 |
576.649 |
17.05% |
61 |
37 |
1.65 |
291 |
144 |
2.02 |
0 |
1 |
1975 |
Nixon |
| 1976 |
653.544 |
13.33% |
61 |
37 |
1.65 |
291 |
144 |
2.02 |
0 |
1 |
1976 |
Nixon |
| 1977 |
718.943 |
10.01% |
61 |
38 |
1.61 |
292 |
143 |
2.04 |
1 |
0 |
1977 |
Carter |
| 1978 |
789.207 |
9.77% |
61 |
38 |
1.61 |
292 |
143 |
2.04 |
1 |
0 |
1978 |
Carter |
| 1979 |
845.116 |
7.08% |
58 |
41 |
1.41 |
277 |
158 |
1.75 |
1 |
0 |
1979 |
Reagan |
| 1980 |
930.21 |
10.07% |
58 |
41 |
1.41 |
277 |
158 |
1.75 |
1 |
0 |
1980 |
Reagan |
| 1981 |
1028.729 |
10.59% |
46 |
53 |
0.87 |
242 |
192 |
1.26 |
0 |
1 |
1981 |
Reagan |
| 1982 |
1197.073 |
16.36% |
46 |
53 |
0.87 |
242 |
192 |
1.26 |
0 |
1 |
1982 |
Reagan |
| 1983 |
1410.702 |
17.85% |
46 |
54 |
0.85 |
269 |
166 |
1.62 |
0 |
1 |
1983 |
Reagan |
| 1984 |
1662.966 |
17.88% |
46 |
54 |
0.85 |
269 |
166 |
1.62 |
0 |
1 |
1984 |
Reagan |
| 1985 |
1945.942 |
17.02% |
47 |
53 |
0.89 |
253 |
182 |
1.39 |
0 |
1 |
1985 |
Reagan |
| 1986 |
2125.303 |
9.22% |
47 |
53 |
0.89 |
253 |
182 |
1.39 |
0 |
1 |
1986 |
Reagan |
| 1987 |
2350.277 |
10.59% |
55 |
45 |
1.22 |
258 |
177 |
1.46 |
0 |
1 |
1987 |
Reagan |
| 1988 |
2602.338 |
10.72% |
55 |
45 |
1.22 |
258 |
177 |
1.46 |
0 |
1 |
1988 |
Bush |
| 1989 |
2857.431 |
9.80% |
55 |
45 |
1.22 |
260 |
175 |
1.49 |
0 |
1 |
1989 |
Bush |
| 1990 |
3233.313 |
13.15% |
55 |
45 |
1.22 |
260 |
175 |
1.49 |
0 |
1 |
1990 |
Bush |
| 1991 |
3665.303 |
13.36% |
56 |
44 |
1.27 |
267 |
167 |
1.60 |
0 |
1 |
1991 |
Bush |
| 1992 |
4064.621 |
10.89% |
56 |
44 |
1.27 |
267 |
167 |
1.60 |
0 |
1 |
1992 |
Bush |
| 1993 |
4411.489 |
8.53% |
57 |
43 |
1.33 |
258 |
176 |
1.47 |
1 |
0 |
1993 |
Clinton |
| 1994 |
4692.75 |
6.38% |
57 |
43 |
1.33 |
258 |
176 |
1.47 |
1 |
0 |
1994 |
Clinton |
| 1995 |
4973.983 |
5.99% |
48 |
52 |
0.92 |
204 |
230 |
0.89 |
1 |
0 |
1995 |
Clinton |
| 1996 |
5224.811 |
5.04% |
48 |
52 |
0.92 |
204 |
230 |
0.89 |
1 |
0 |
1996 |
Clinton |
| 1997 |
5413.146 |
3.60% |
45 |
52 |
0.87 |
207 |
226 |
0.92 |
1 |
0 |
1997 |
Clinton |
| 1998 |
5526.193 |
2.09% |
45 |
52 |
0.87 |
207 |
226 |
0.92 |
1 |
0 |
1998 |
Clinton |
| 1999 |
5656.271 |
2.35% |
45 |
52 |
0.87 |
211 |
223 |
0.95 |
1 |
0 |
1999 |
Clinton |
|
|
|
45 |
52 |
0.87 |
211 |
223 |
0.95 |
1 |
0 |
2000 |
Clinton |
(Back to top of data tables)
(Back to
the top of Federal Debt)
(Back to Economy and
Political Parties)
(Back to
Politics) |