(Back to
Politics)
(Back to United States Health and
Political Parties)
(Go to data table at
bottom.)
The gun-deaths rate (number of deaths per 1000 people) varies greatly among the states in the United States. (See table at end for 1996 rates.) (These are all gun deaths including assault, suicides and accidents.)
An interesting question to ask is: Is there any correlation between the gun-deaths rate and the strength of the two political parties in the states?
I compared different state's gun-deaths rate (GDR) data for 1996 with the results of the 1996 presidential election for each state. (See table at end for votes in the 1996 election.) A correlation calculation yielded the following:
| Correlation | Rate |
| Democrat vote | -0.429 |
| Republican vote | +0.533 |
That is, the Democratic votes for the states had a 43% negative correlation with increasing GDR and the Republican votes had a 53% positive correlation. States with high gun-deaths rate vote much more Republican than Democratic and vice versa.
|
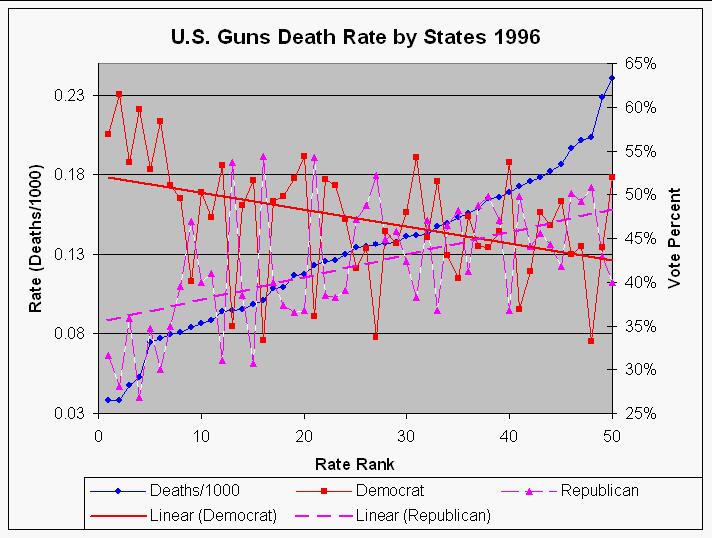
| This is a plot of the gun-deaths rate (GDR) sorted by rank of the states compared to the Democratic votes and the Republican votes. (See table at end for the data.) Also shown are linear fits to the two votes. This shows visually the positive correlation of GDR with the Republican vote and the negative correlation of GDR with the Democratic vote. Note that the eight lowest GDR states are definitely Democratic. |
What can one conclude from these results? Whatever factors cause the large disparity for gun-deaths rates between the various states also cause those states to tend to vote Republican. I believe that the main factors are:
My Republican native state, Oklahoma (rate=0.154), ranked 35 of 50 and my Republican adopted state, Virginia (rate=0.143), ranked 32 of 50 for increasing gun-deaths rate in 1999.
There are various gun regulations in the different states, which can be found at http://www.csgv.org/content/resources/frame_resc_laws.html. A good question to ask is: How do the various regulations correlate with gun deaths? I selected the following five regulation types for such a study:
The table of the scores is given in the second table below.
The correlation coefficients are:
| Correlations | Registration? | Background Check? | Purchase Limit? | Waiting Period? | Concealed Weapons? | Deaths/1000 |
| Deaths/1000 | -0.276 | -0.212 | 0.084 | -0.460 | -0.394 | |
| Democrat | 0.389 | 0.135 | 0.063 | 0.457 | 0.311 | -0.429 |
| Republican | -0.338 | -0.152 | 0.058 | -0.449 | -0.289 | 0.533 |
Thus, the most effective regulation (high negative correlations) is having a waiting period for purchases of guns, followed by restrictions on concealed weapons, followed by having gun registration, then followed by having background checks. Having a purchasing limit has a slightly positive correlation. It makes sense that having a waiting period for purchases and restricting concealed weapons would be effective, since both contribute to a cooling-down period when anger motivates someone to shoot someone else.
Note that mostly Democratic states have the effective restrictions (high positive correlations), and that Republican states have negative correlations with the effective restrictions.
| U.S. Gun Deaths 1996 | 1996 election | |||||
| State | Deaths | Population | Deaths/1000 | Democrat | Republican | Rank |
| Hawaii | 45 | 1184434 | 0.038 | 56.9% | 31.6% | 1 |
| Massachusetts | 232 | 6085393 | 0.038 | 61.5% | 28.1% | 2 |
| New Jersey | 381 | 8009624 | 0.048 | 53.7% | 35.9% | 3 |
| Rhode Island | 52 | 987858 | 0.053 | 59.7% | 26.8% | 4 |
| Connecticut | 244 | 3267030 | 0.075 | 52.8% | 34.7% | 5 |
| New York | 1400 | 18143805 | 0.077 | 58.3% | 30.0% | 6 |
| Minnesota | 369 | 4647723 | 0.079 | 51.1% | 35.0% | 7 |
| New Hampshire | 94 | 1160768 | 0.081 | 49.6% | 39.6% | 8 |
| North Dakota | 54 | 642858 | 0.084 | 40.1% | 46.9% | 9 |
| Iowa | 246 | 2848473 | 0.086 | 50.3% | 39.9% | 10 |
| Ohio | 990 | 11187032 | 0.088 | 47.4% | 41.0% | 11 |
| Vermont | 55 | 586352 | 0.094 | 53.4% | 31.1% | 12 |
| Nebraska | 156 | 1647657 | 0.095 | 35.0% | 53.7% | 13 |
| Wisconsin | 494 | 5173828 | 0.095 | 48.8% | 38.5% | 14 |
| Maine | 122 | 1241436 | 0.098 | 51.6% | 30.8% | 15 |
| Utah | 204 | 2022253 | 0.101 | 33.3% | 54.4% | 16 |
| Pennsylvania | 1310 | 12038008 | 0.109 | 49.2% | 40.0% | 17 |
| Washington | 601 | 5509963 | 0.109 | 49.8% | 37.3% | 18 |
| Delaware | 85 | 727090 | 0.117 | 51.8% | 36.6% | 19 |
| Illinois | 1401 | 11953003 | 0.117 | 54.3% | 36.8% | 20 |
| Kansas | 320 | 2598266 | 0.123 | 36.1% | 54.3% | 21 |
| Michigan | 1222 | 9739184 | 0.125 | 51.7% | 38.5% | 22 |
| California | 4004 | 31780829 | 0.126 | 51.1% | 38.2% | 23 |
| Oregon | 415 | 3195087 | 0.130 | 47.2% | 39.1% | 24 |
| Indiana | 785 | 5834908 | 0.135 | 41.6% | 47.1% | 25 |
| Texas | 2564 | 19006240 | 0.135 | 43.8% | 48.8% | 26 |
| Idaho | 162 | 1187706 | 0.136 | 33.6% | 52.2% | 27 |
| Kentucky | 532 | 3881051 | 0.137 | 45.8% | 44.9% | 28 |
| Colorado | 523 | 3812716 | 0.137 | 44.4% | 45.8% | 29 |
| Florida | 2042 | 14426911 | 0.142 | 48.0% | 42.3% | 30 |
| Maryland | 717 | 5057142 | 0.142 | 54.3% | 38.3% | 31 |
| Virginia | 950 | 6665491 | 0.143 | 45.1% | 47.1% | 32 |
| West Virginia | 268 | 1818983 | 0.147 | 51.5% | 36.8% | 33 |
| South Dakota | 109 | 730699 | 0.149 | 43.0% | 46.5% | 34 |
| Oklahoma | 505 | 3289634 | 0.154 | 40.4% | 48.3% | 35 |
| Missouri | 835 | 5367888 | 0.156 | 47.5% | 41.2% | 36 |
| North Carolina | 1162 | 7307658 | 0.159 | 44.0% | 48.7% | 37 |
| South Carolina | 617 | 3738974 | 0.165 | 44.0% | 49.8% | 38 |
| Georgia | 1215 | 7332225 | 0.166 | 45.8% | 47.0% | 39 |
| Arkansas | 423 | 2504858 | 0.169 | 53.7% | 36.8% | 40 |
| Wyoming | 83 | 480085 | 0.173 | 36.8% | 49.8% | 41 |
| Montana | 154 | 876656 | 0.176 | 41.3% | 44.1% | 42 |
| Tennessee | 948 | 5313576 | 0.178 | 48.0% | 45.6% | 43 |
| Arizona | 806 | 4432308 | 0.182 | 46.5% | 44.3% | 44 |
| New Mexico | 318 | 1706151 | 0.186 | 49.2% | 41.9% | 45 |
| Alabama | 844 | 4290403 | 0.197 | 43.2% | 50.1% | 46 |
| Mississippi | 547 | 2709925 | 0.202 | 44.1% | 49.2% | 47 |
| Alaska | 123 | 604918 | 0.203 | 33.3% | 50.8% | 48 |
| Nevada | 365 | 1596476 | 0.229 | 43.9% | 42.9% | 49 |
| Louisiana | 1044 | 4338763 | 0.241 | 52.0% | 39.9% | 50 |
(Back to top of data
table)
(Back to the top of this page)
(Back to United States Health and Political
Parties)
(Back to Politics)