Brief Instructions for Using the PHYLIP/Neighbor or
Kitsch Programs to Calculate and the TreeView Program to Plot Phylograms
L. David Roper (roperld@vt.edu)
(www.roperld.com)
The PHYLIP and TreeView programs can be downloaded at:
- PHYLIP
software. Only the Neighbor or Kitsch program is used. The Neighbor program
can be much faster than the Kitsch program, but it is not as accurate. (I have
tested the two programs and found that, indeed, Neighbor is not very accurate
even for a small number of persons. The Neighbor program computer time
increases as the square of the number of persons and the Kitsch computer time
increases as the fourth power of the number of persons. I usually use Neighbor because it is much faster and is accurate enough for my purposes.
- TreeView software
The following rules describe how I use the Neighbor or the Kitsch
program of PHYLIP to calculate a phylogram tree file for the 25 Y-chromosome
markers:
- Use MS Excel to create a relative-mutations matrix for the set of
25-markers for which I want a phylogram.
- Copy the relative-mutations matrix and then paste it into MS NotePad.
(Do not use MS Word, because you will get a table instead of text.) There will
be tabs between each element of the matrix.
- Count the number of lines in the relative-mutations matrix and type
that number in the first line of the file.
- There must be exactly ten characters or spaces at the beginning of
each line after the first line. Replace the tab after the name at the beginning
of each line of the matrix with enough spaces to make ten characters or
spaces.
- If you name the file infile in the same directory as the
Neighbor or Kitsch program is in, the program will use that file when you run
it. I prefer to create a directory called Data, in the directory of the
Neighbor program, in which to put the data file and to give it a descriptive
name.
- Run the Neighbor or Kitsch program. (I put a shortcuts for them on
the desktop.) When it asks for a data file, type
Data\<yourfilename>.
- Then for the Neighbor program type N to use the
UPGMA option (Unweighted Pair Group Method with
Arithmetic Mean).
- Then type L to use lower-triangular matrix input or R to use
upper-triangular matrix input, depending on how you arrange the
relative-mutations matrix.
- It is recommended that the Jumble option be used to increase the
probability of finding the best tree. If you select J you will be asked to
input a random-number seed and how many times to jumble the input; ten times is
recommended.
- Then type Y to do the calculation. After the calculation the Neighbor
program will close itself.
- The calculation creates two files in the directory with the Neighbor
program: outfile and treefile. Ignore the outfile.
- Create a directory Tree under the Neighbor directory and move
treefile to that directory. Rename treefile to a descriptive name with a tre
suffix; e.g. Roper.tre .
- If the TreeView program installed correctly, all you need to do now
is just click on the *.tre file to put it into the TreeView program.
- After the tree is shown in TreeView, choose the Tree-Phylogram
option.
- Now do File-Save as graphic and choose the *.wmf type of graphics
file. Use some graphics program to convert this *.wmf file to *.jpg or *.gif
.
- Now you have a file that you can use in a document or on a web
page.
For another description of the procedure given above see CalculateAndPlotPhylograph.pdf .
Here is an example input file for 25 Y-chromosome markers:
Roper.txt
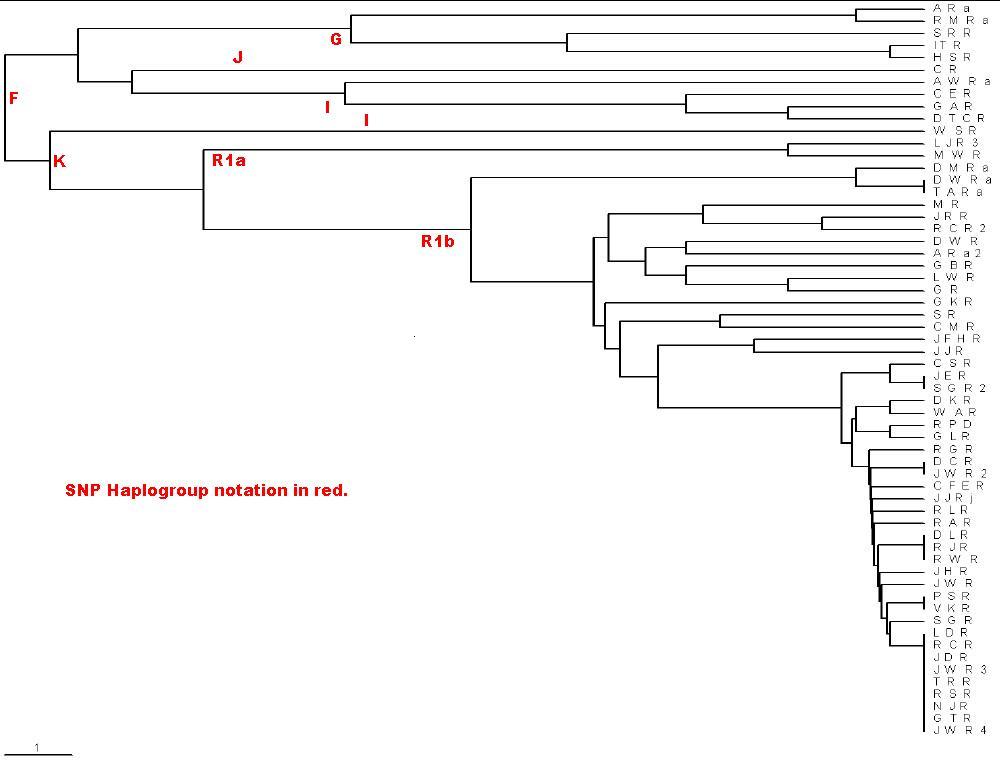
Here is the phylogram created by the rules above for the Roper.txt
file:
Note the scale in the lower left corner: The distance shown is 0.1
relative mutations. For long times for 25 markers, 1 relative mutation is about
500 years, assuming a generation is 25 years and the average mutation rate is
1/500. The extreme right is the present time. Do not use this calculation for
short times, because a mutation can occur in 1 generation or 25 years. You can
use the scale to label the the earliest-time junctions with the time before the
present (ybp). I use the MS Paint program to do this. The PHYLIP Neighbor
UPGMA/TreeView calculation/plot does not give a good representation of the data
for Y-chromosome marker sets when several of the testees only differ by one
relative mutation. However, it does rather faithfully show the large relative
mutations.
On my 3.06 GHz machine it took slightly over one hour to do a
PHYLIP/Kitsch calculation for the relative mutations of 128 individuals with 10
jumbles.

